


Mapping our geologically active world is no easy feat – using topography, science offers us a glimpse into the complex mechanisms behind everchanging landscapes. But you don't have to be a scientist to enjoy a topo map, as modern day mapping techniques can now create beautiful topographic fusions of art and science.
In this article, we'll be teaching you how to read topographic maps, covering everything from the many symbols used to all the different colors that adorn these works of art.
What are topographic maps?
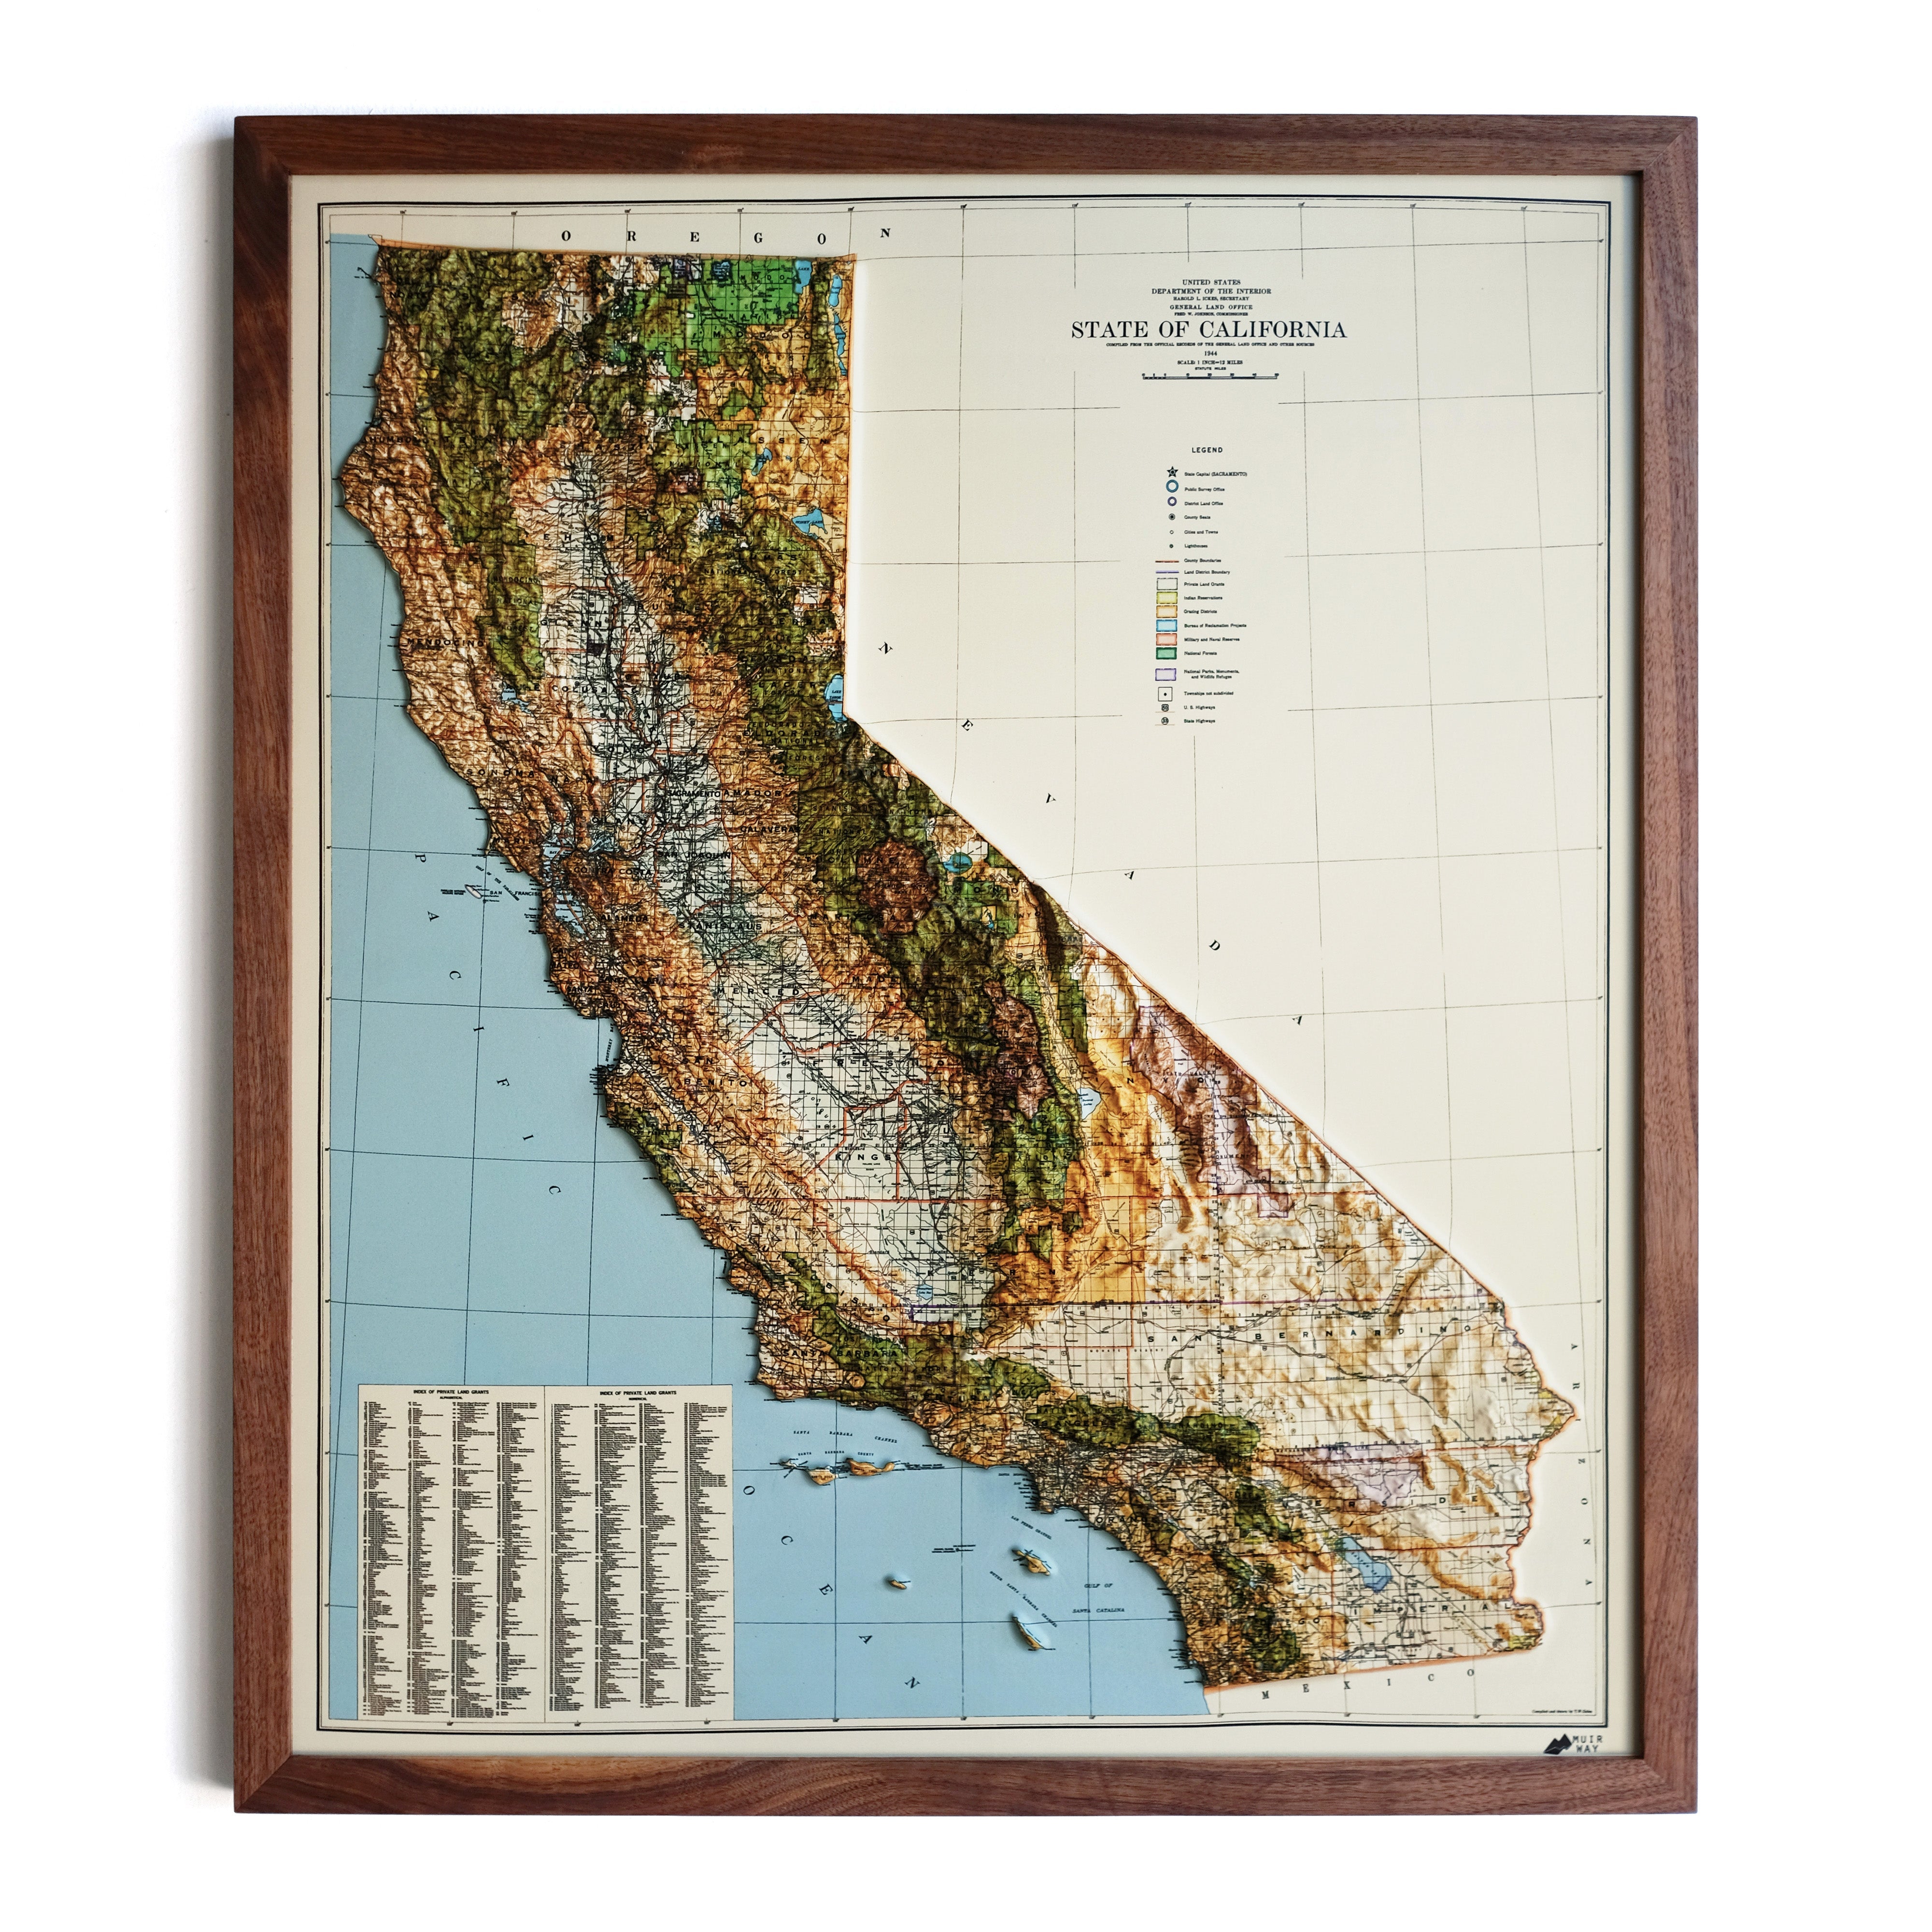
A topographic map is one of the best ways you can visualize and explore our planet’s vast, beautiful landscapes and geological features. Before we fully dive in, you should keep in mind that you may come across a few different labels for these kinds of maps. These names are interchangeable, but it’s good to be aware of them either way:
-
Topographic or topographical maps
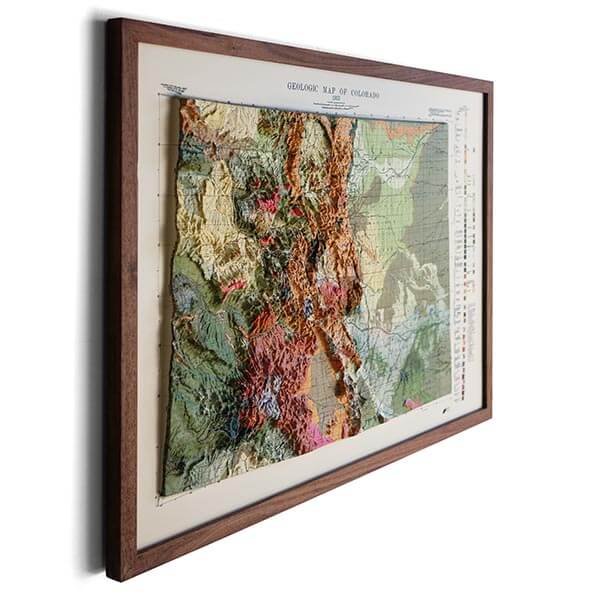
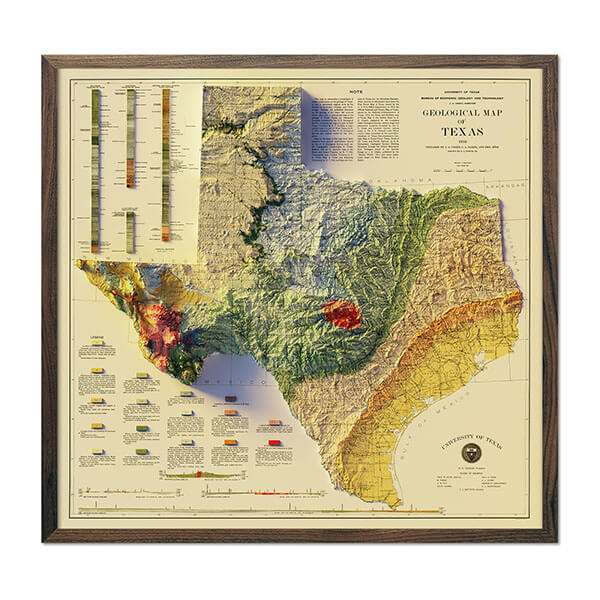
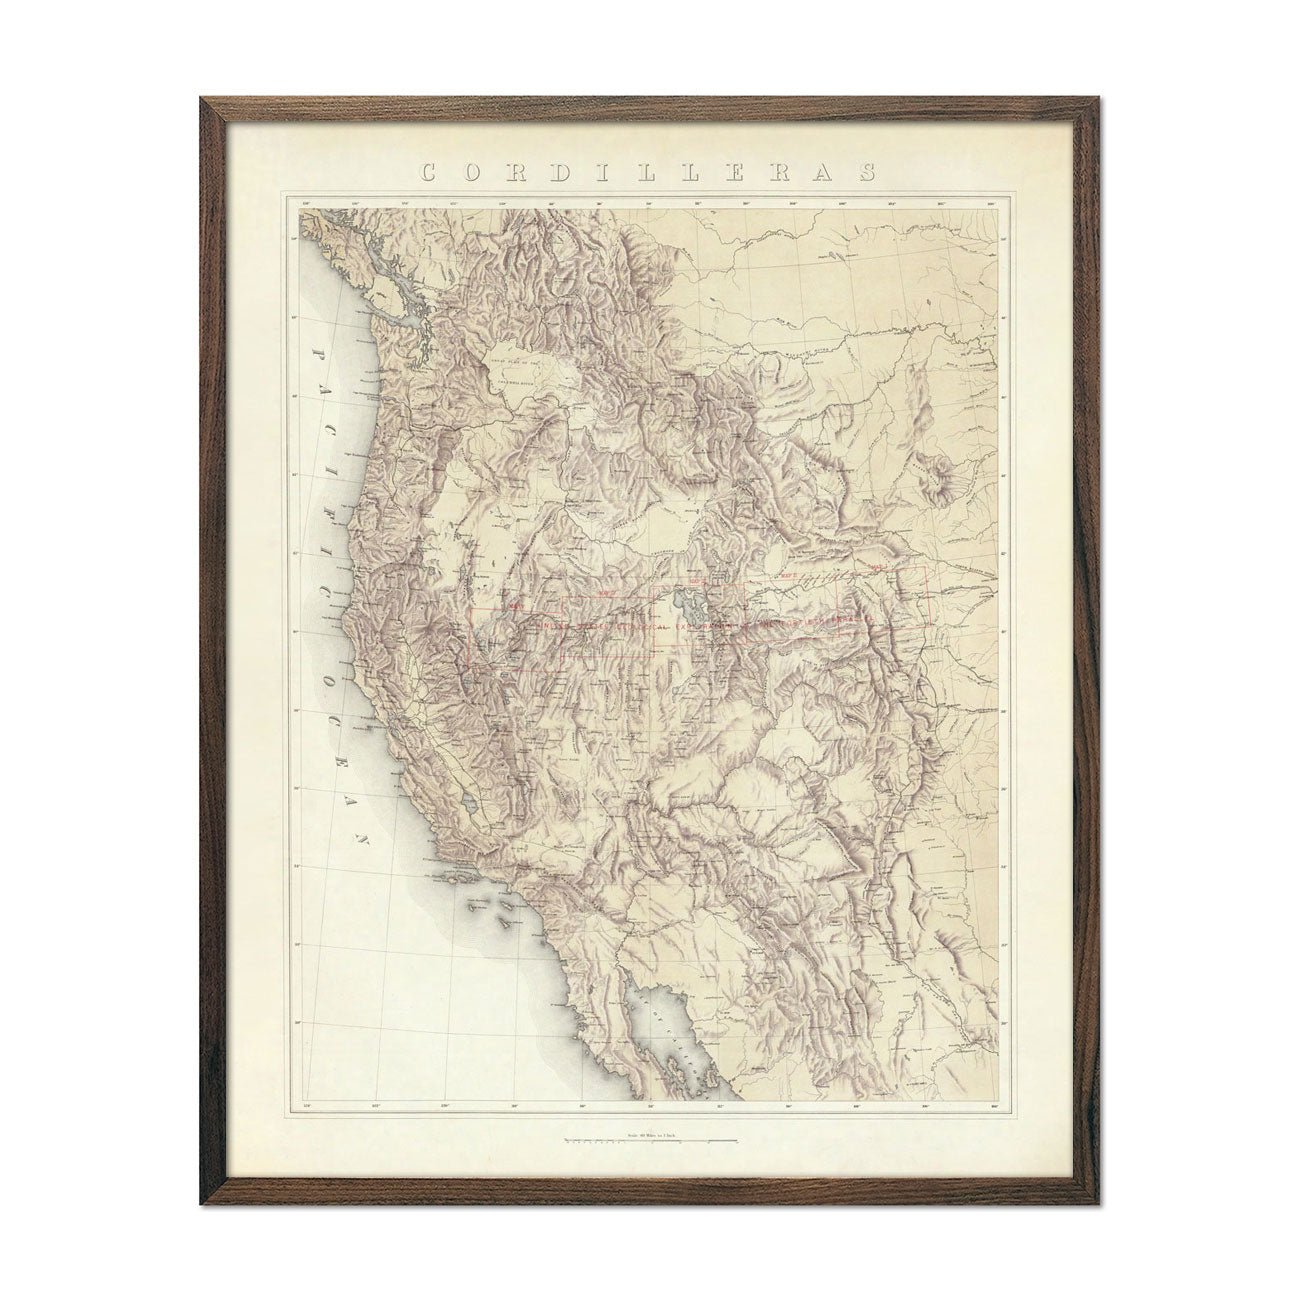
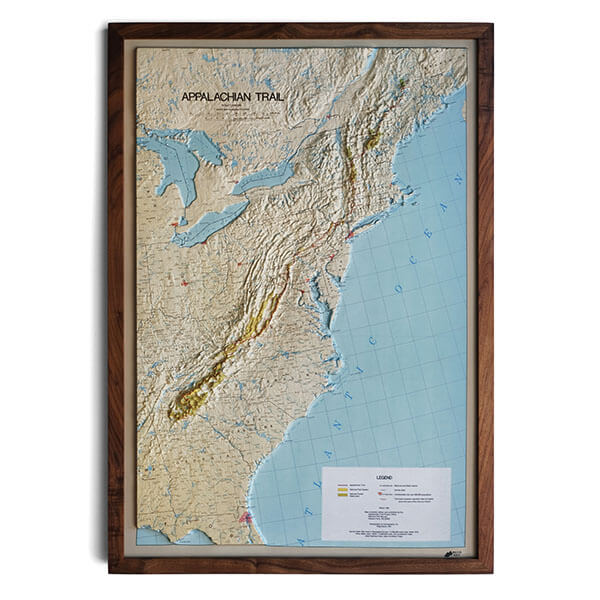
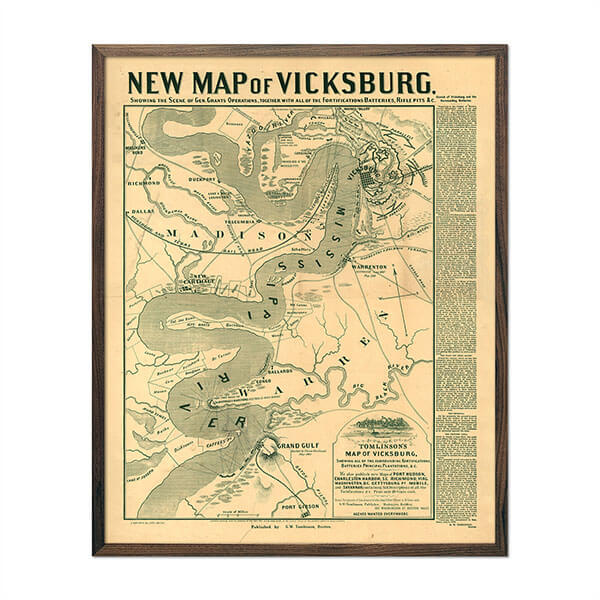
Traditionally, vintage topo maps were used as aids in military expeditions, national infrastructure planning, and the extraction of resources such as oil or minerals. While these traditional uses are still important, modern day topo maps are used in countless other industries as well in combination with geological maps – for example, some of your favorite hiking trails may have been designed using a topo map!
Like their many names imply, the main feature of these maps is their ability to show us terrain and land features in amazing detail. Here are just a few details a topographic map may bring to light:
-
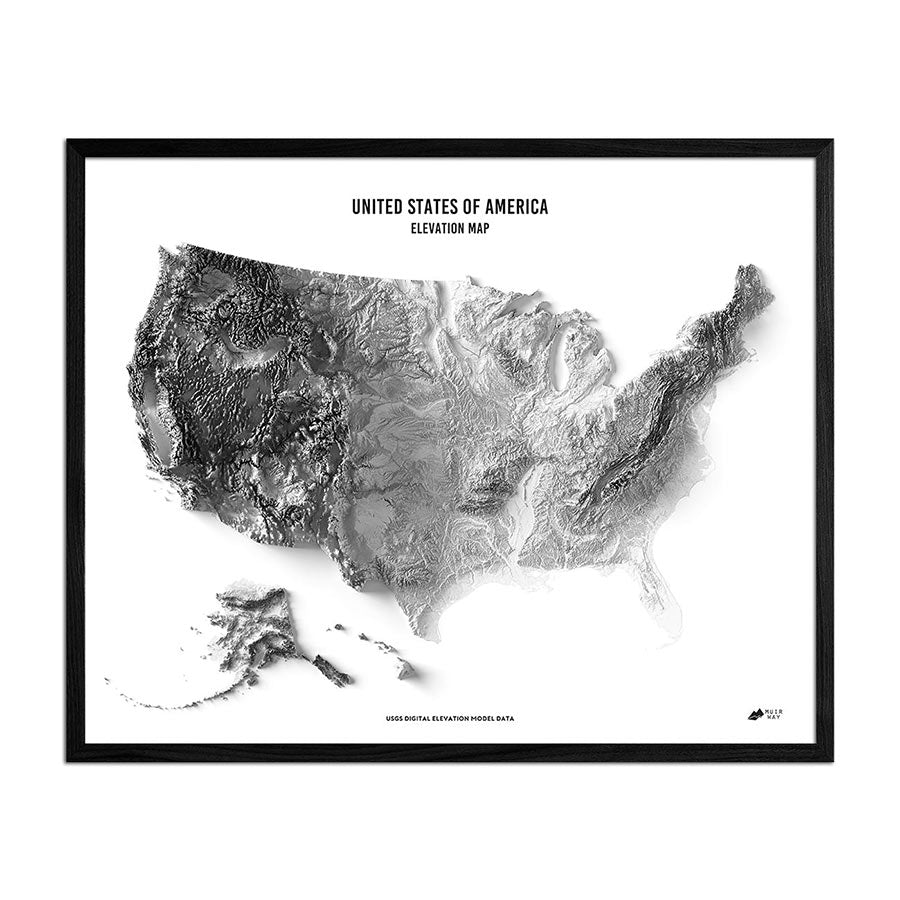
Elevation changes, which are shown through contour lines
-
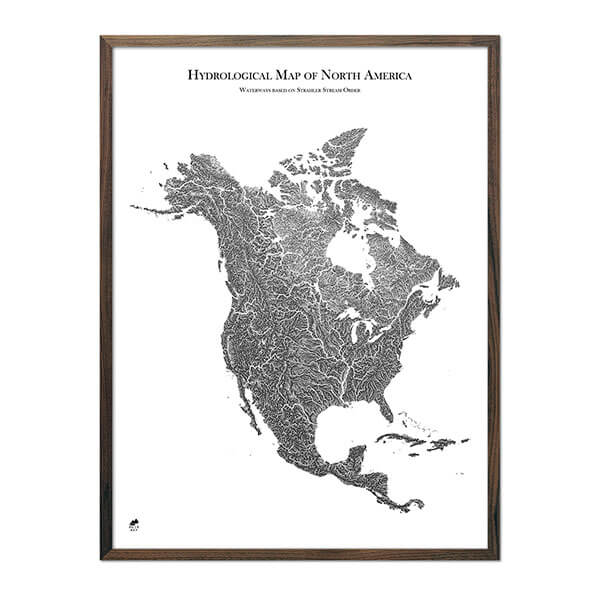
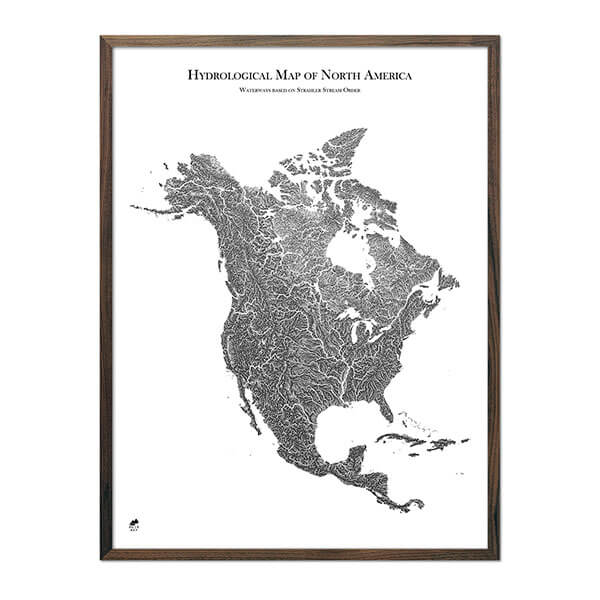
Streams, rivers, lakes, and various other important bodies of water
-
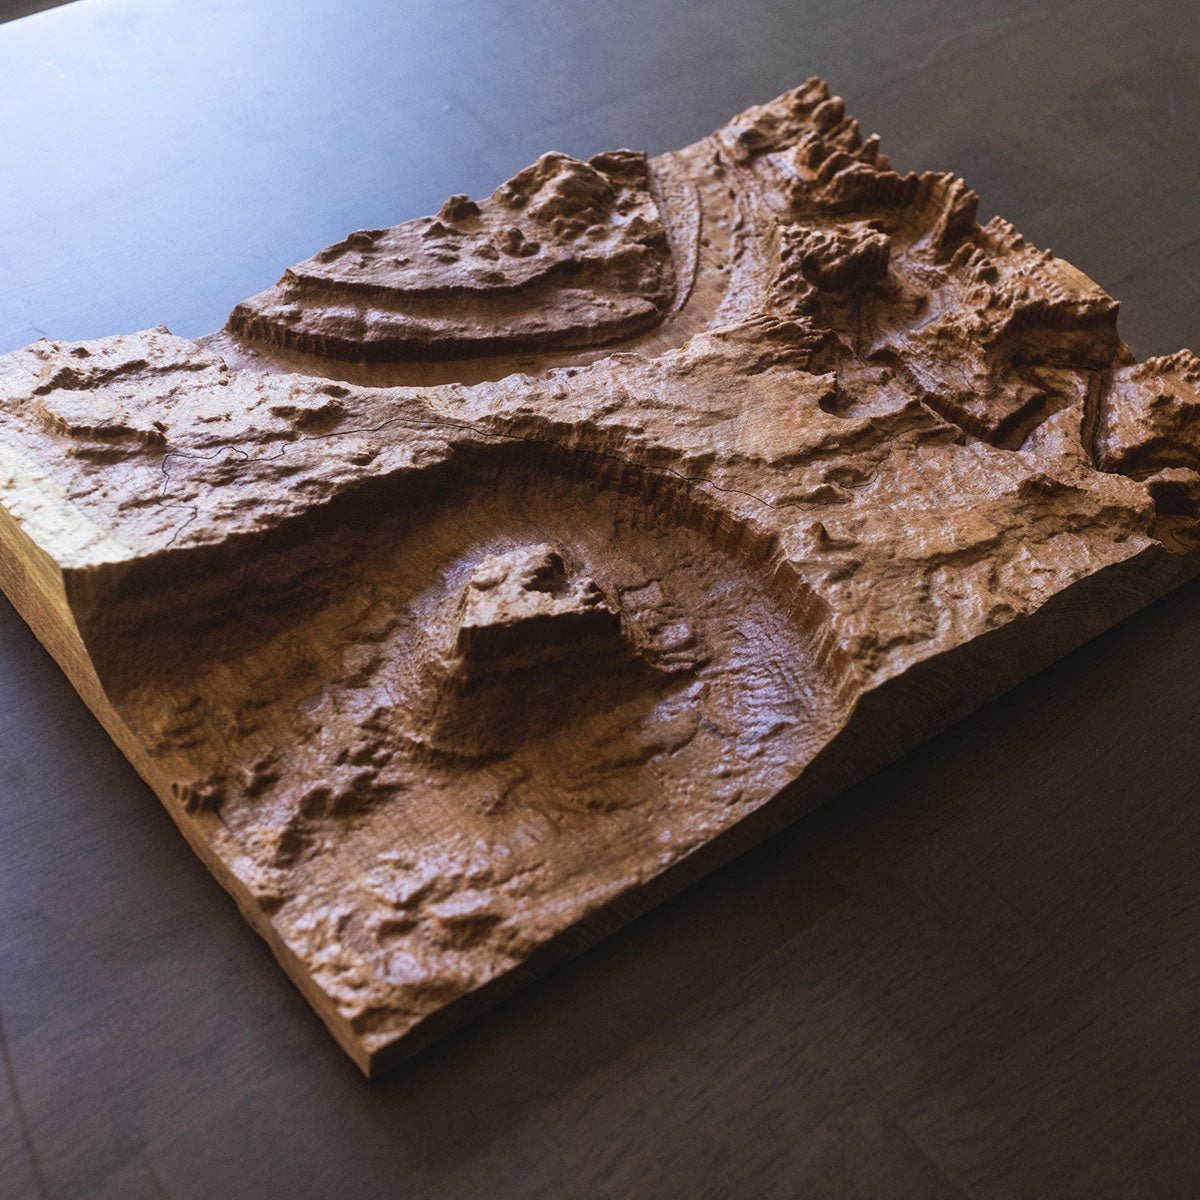
Mountains, forests, tree cover, and other large natural features
-
Trails, roads, railroads, and other major transportation infrastructure
-
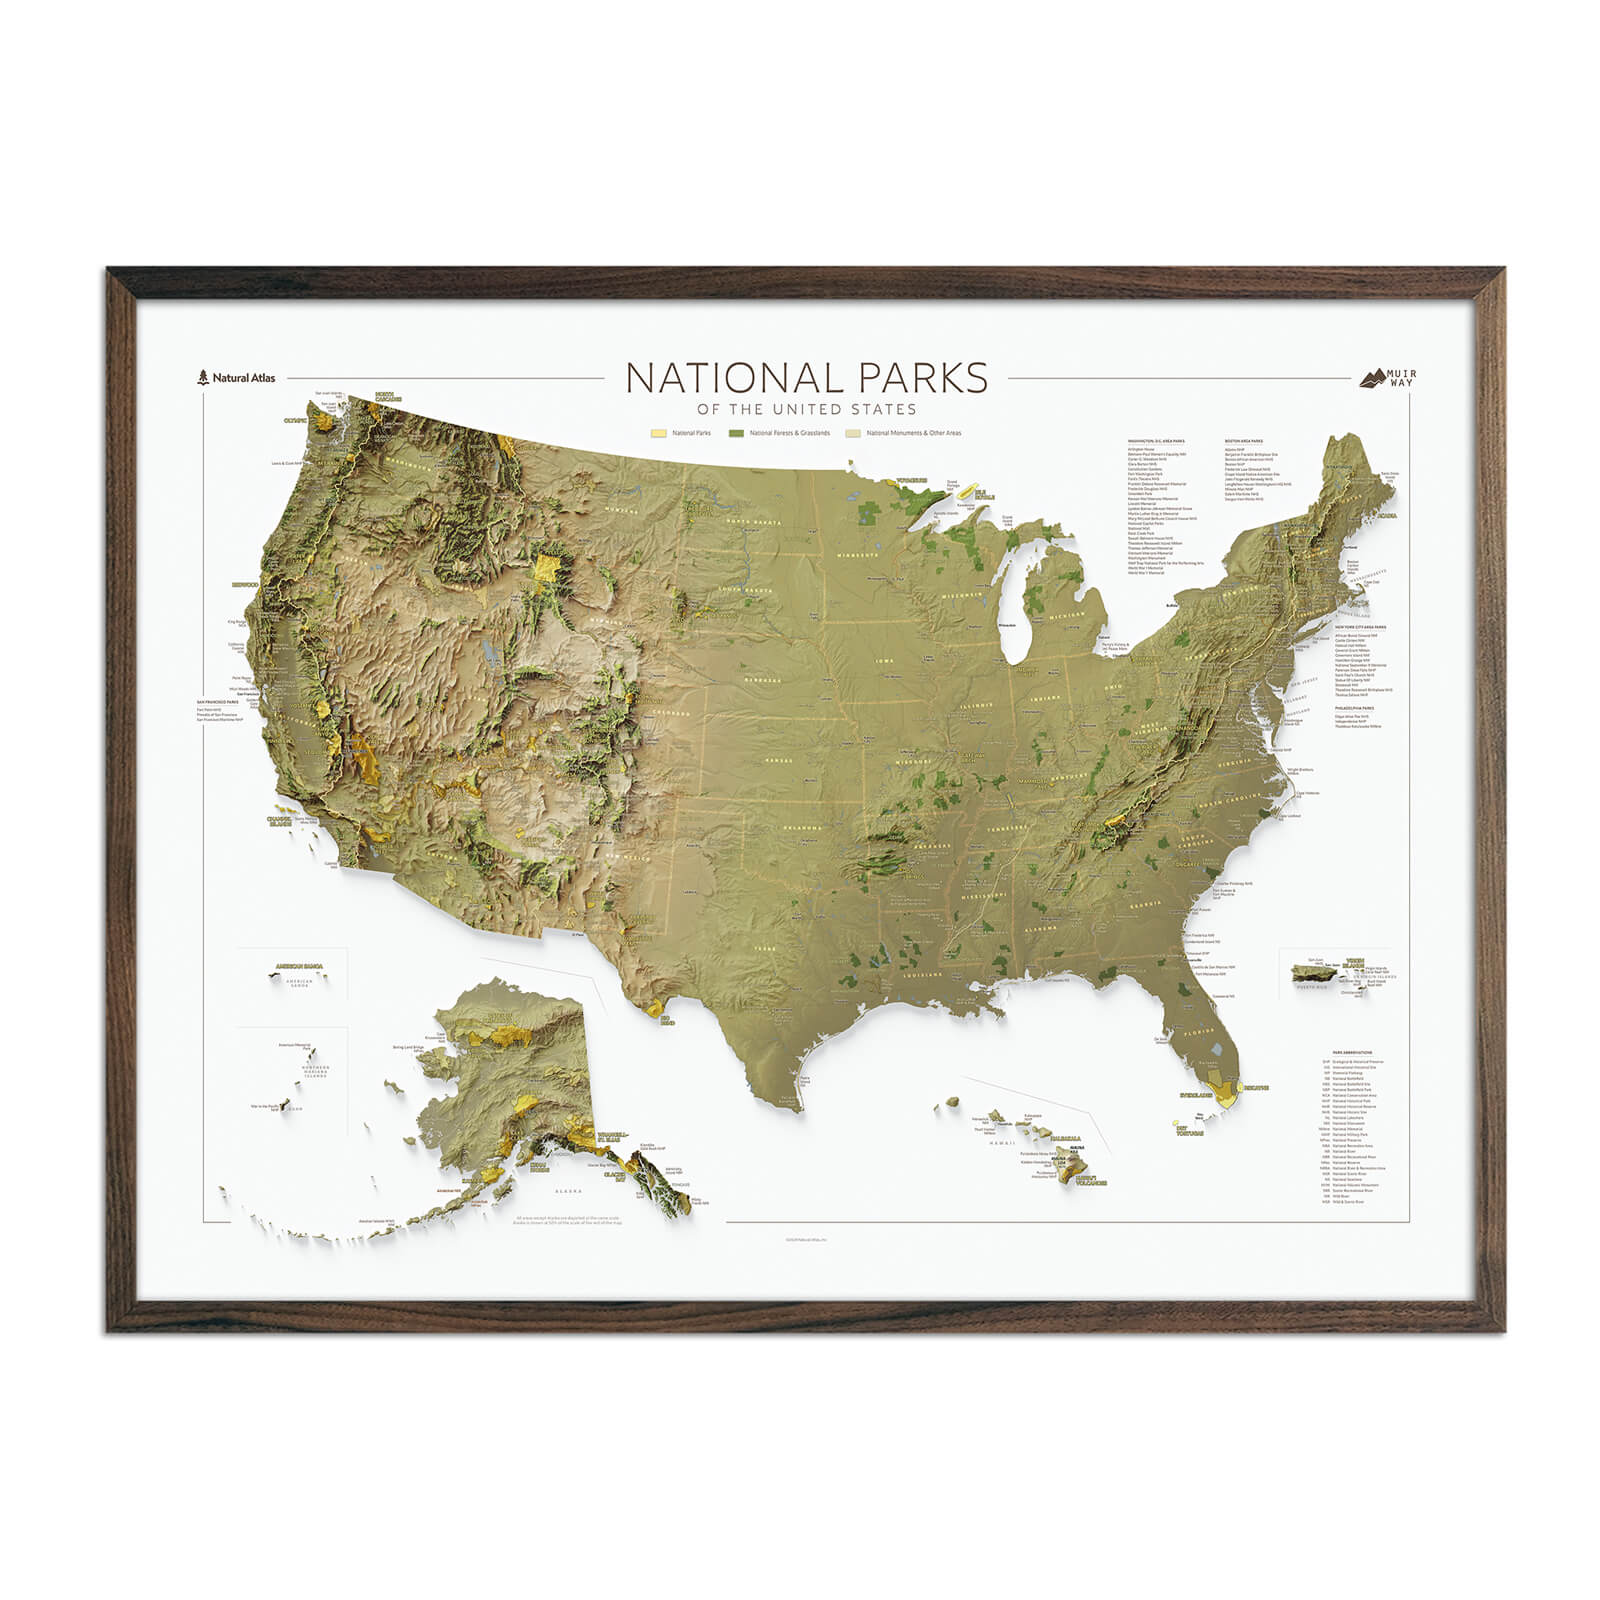
Towns, cities, national parks, state parks, and more depending on the particular map
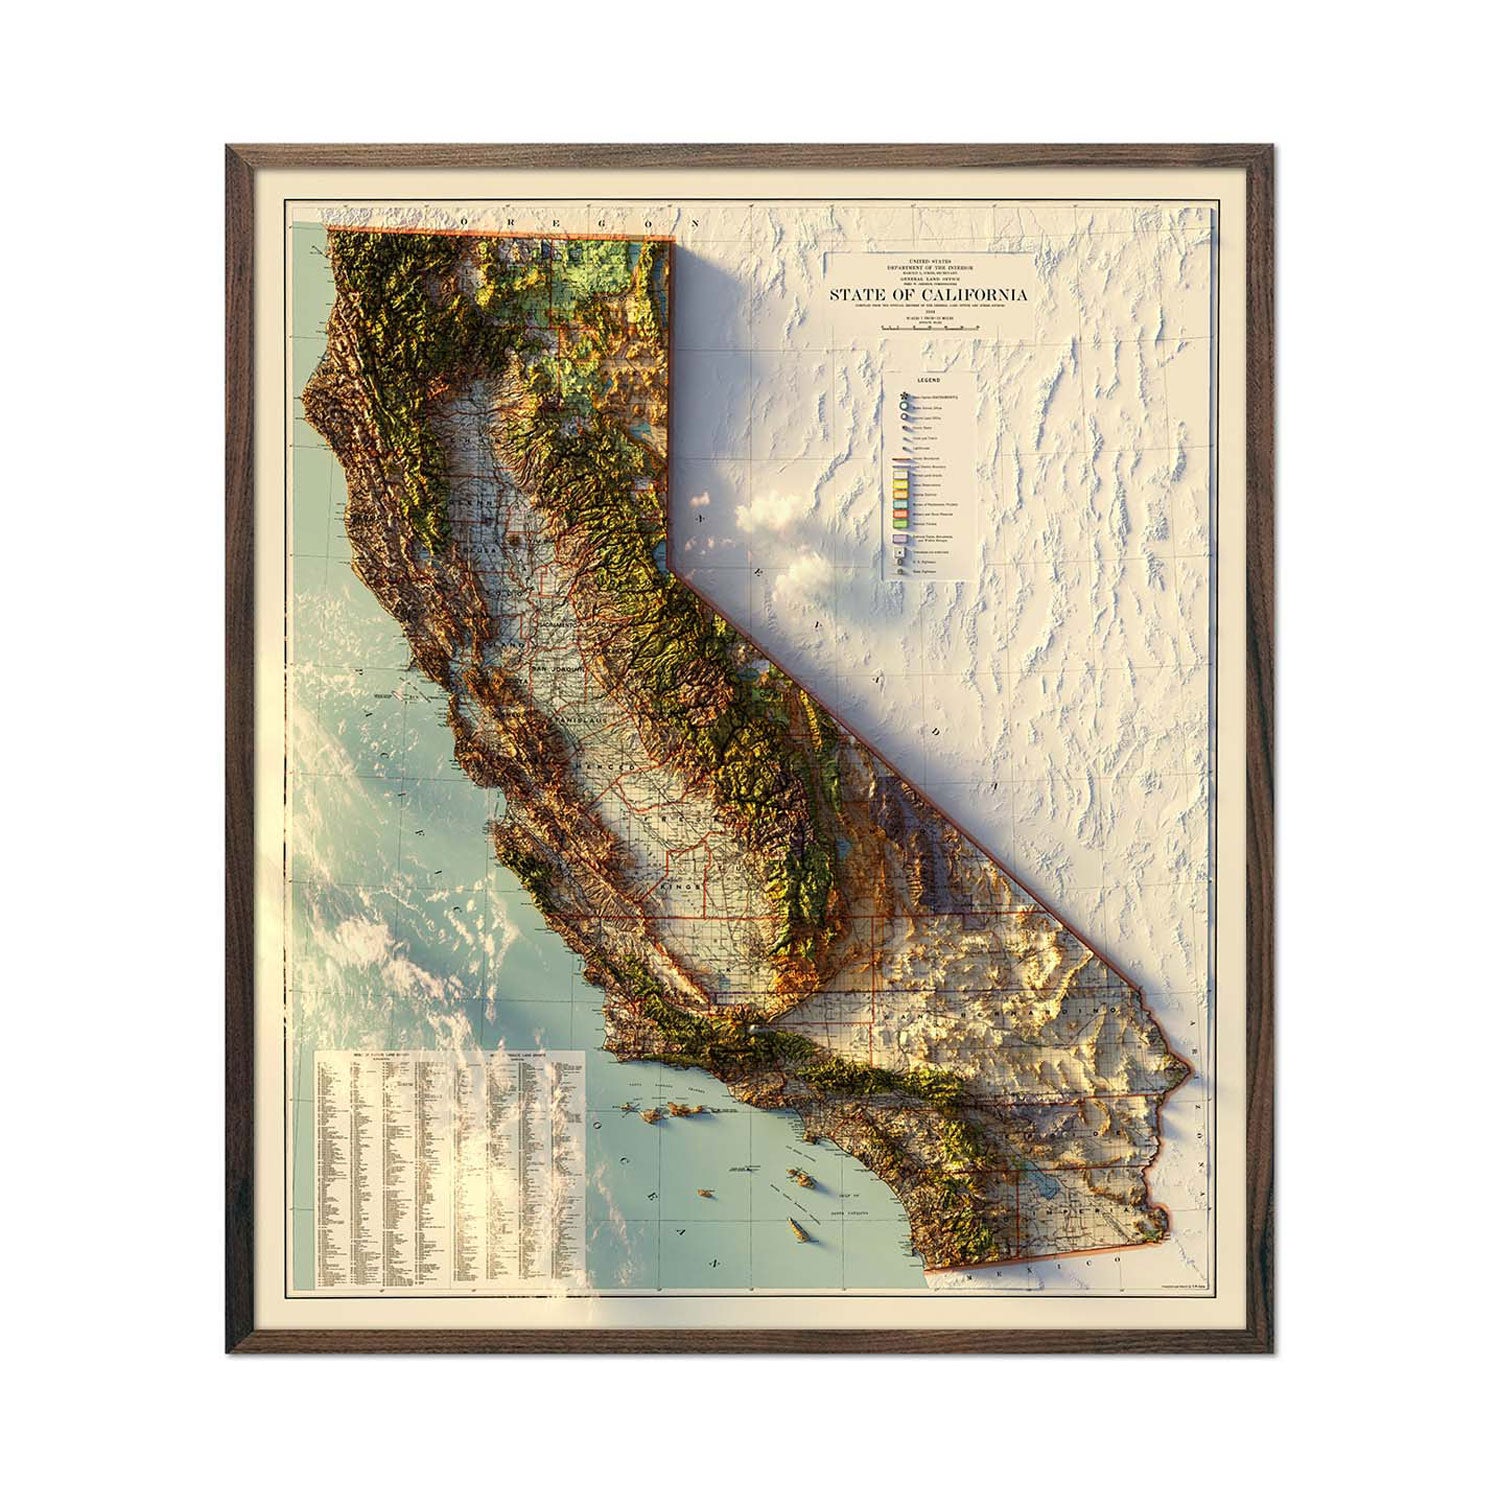
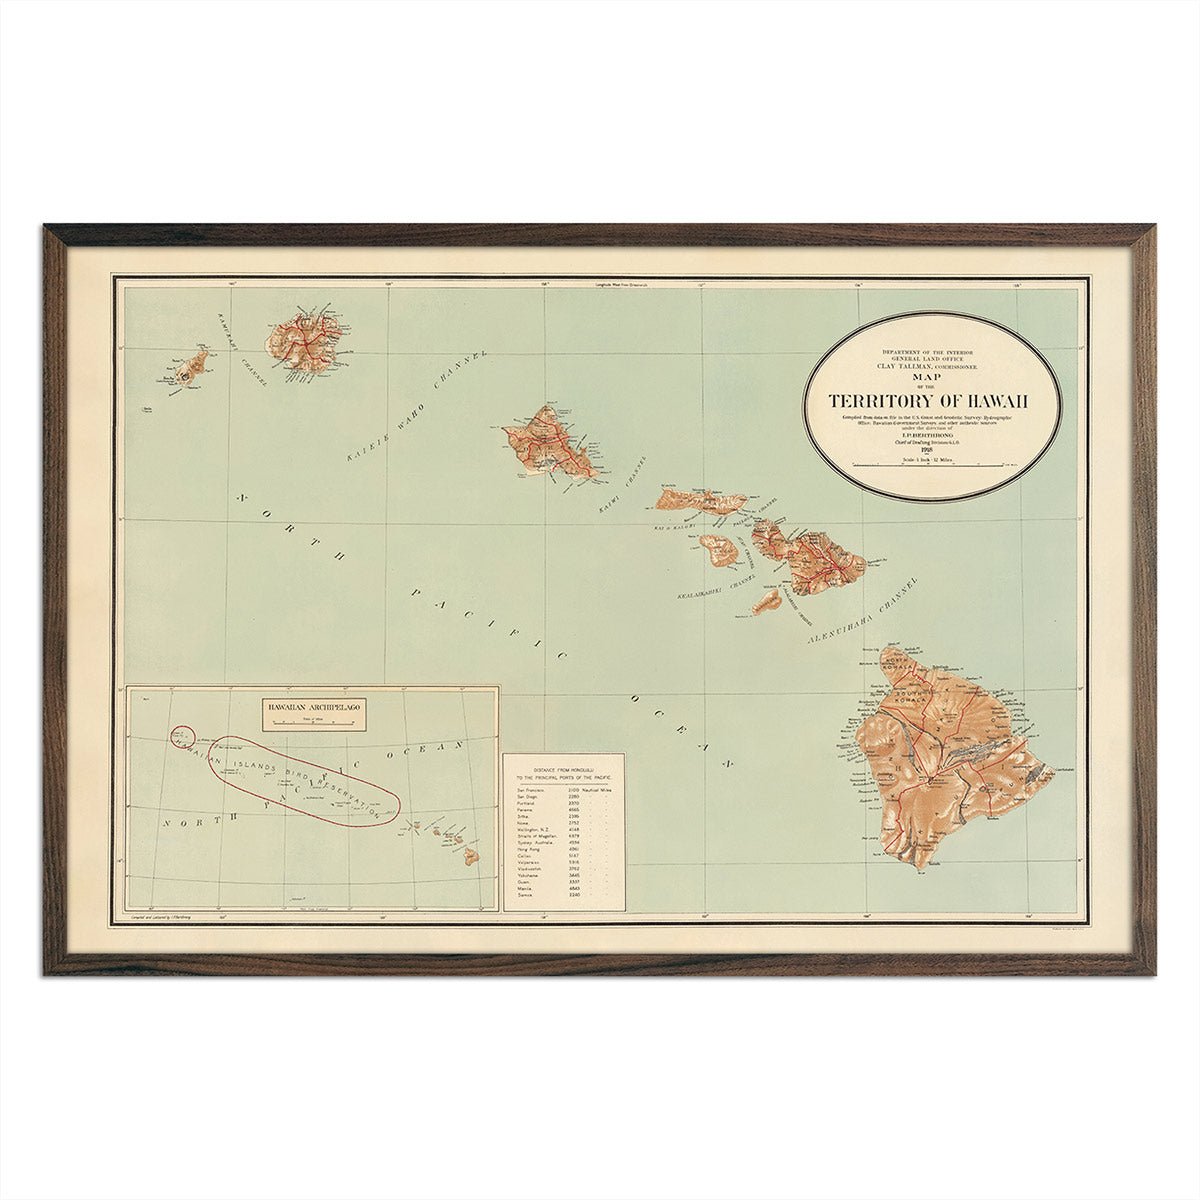
Each map is unique, and the features shown or hidden will depend on where your map was made. Harder to find in the past, highly-detailed topo maps of specific regions like Hawaii can now be purchased and enjoyed by anyone who’s interested in owning one.
Why should you use topo maps?
You don’t have to be a cartographer to use or enjoy a topo map. That isn’t to say it’s easy to read these kinds of maps – like anything – it’s going to take a bit of practice to get good at. And while reading and studying topo maps is a popular hobby, many simply just appreciate them for their aesthetic mixture of science and art.
Either way, let’s take a look at the different elements you’ll find on a topographic map.
How is a topo map made?
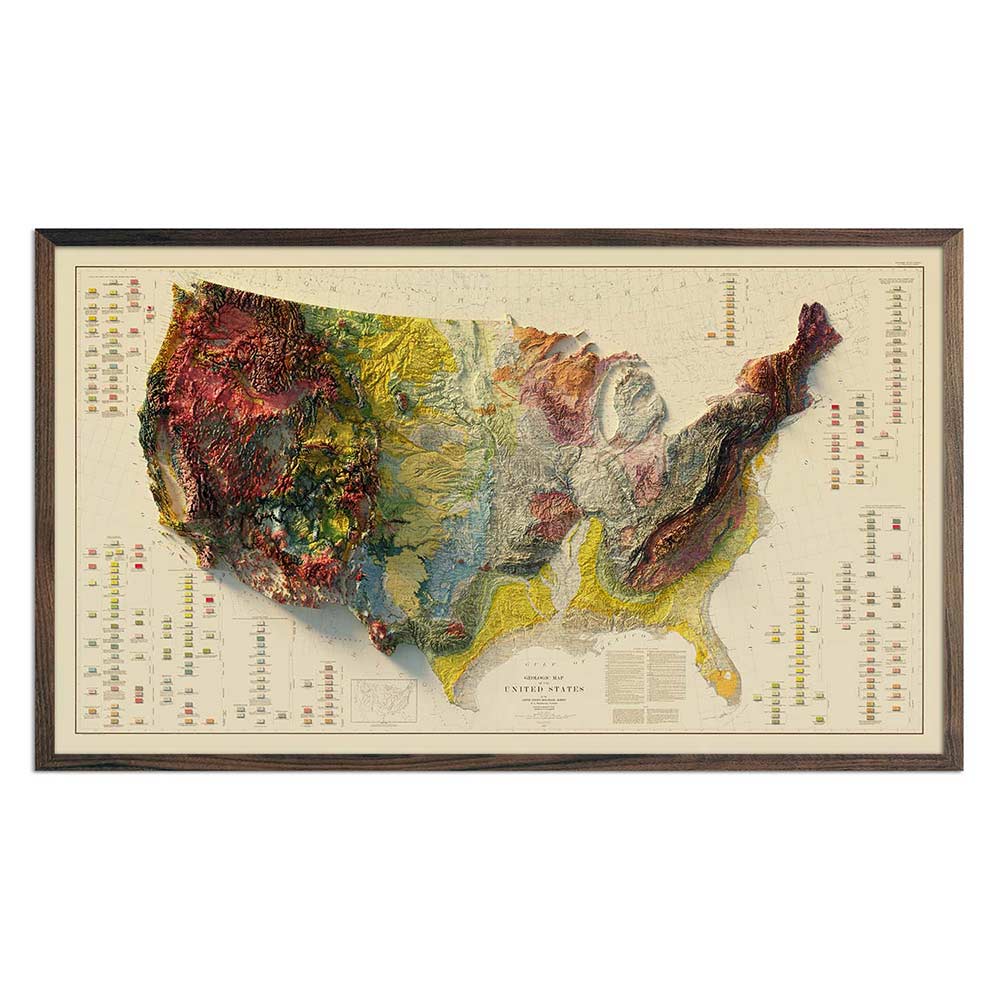
A topo map is created based on data gathered during topographical surveys by organizations like the United States Geological Survey (USGS). Some maps are based on local public land survey data, with others using data that spans the entire United States – as well as every other nation on Earth.
Nowadays, terrain features are rapidly mapped using satellite imagery, GPS, and specialty software; this explosion in mapping technology within the last 50 years has led to both a decrease in traditional map-making and an increase in accurate, highly-accessible public resources. Over time, huge data sets have managed to produce maps that are now used in hundreds of different vital industries.
Specialty companies, including us at Muir Way, are now capable of using publicly available topo maps to create works of art for you to enjoy!
How can you read a topographic map?
Topographic map features including many different lines, symbols, and other details represent specific things within the environment being mapped out. Other topographic symbols like elevation changes, waterways, towns and cities, and more are represented by markers usually found on the map legend. Let’s go over some of the main concepts you’ll want to understand when reading a topo map:
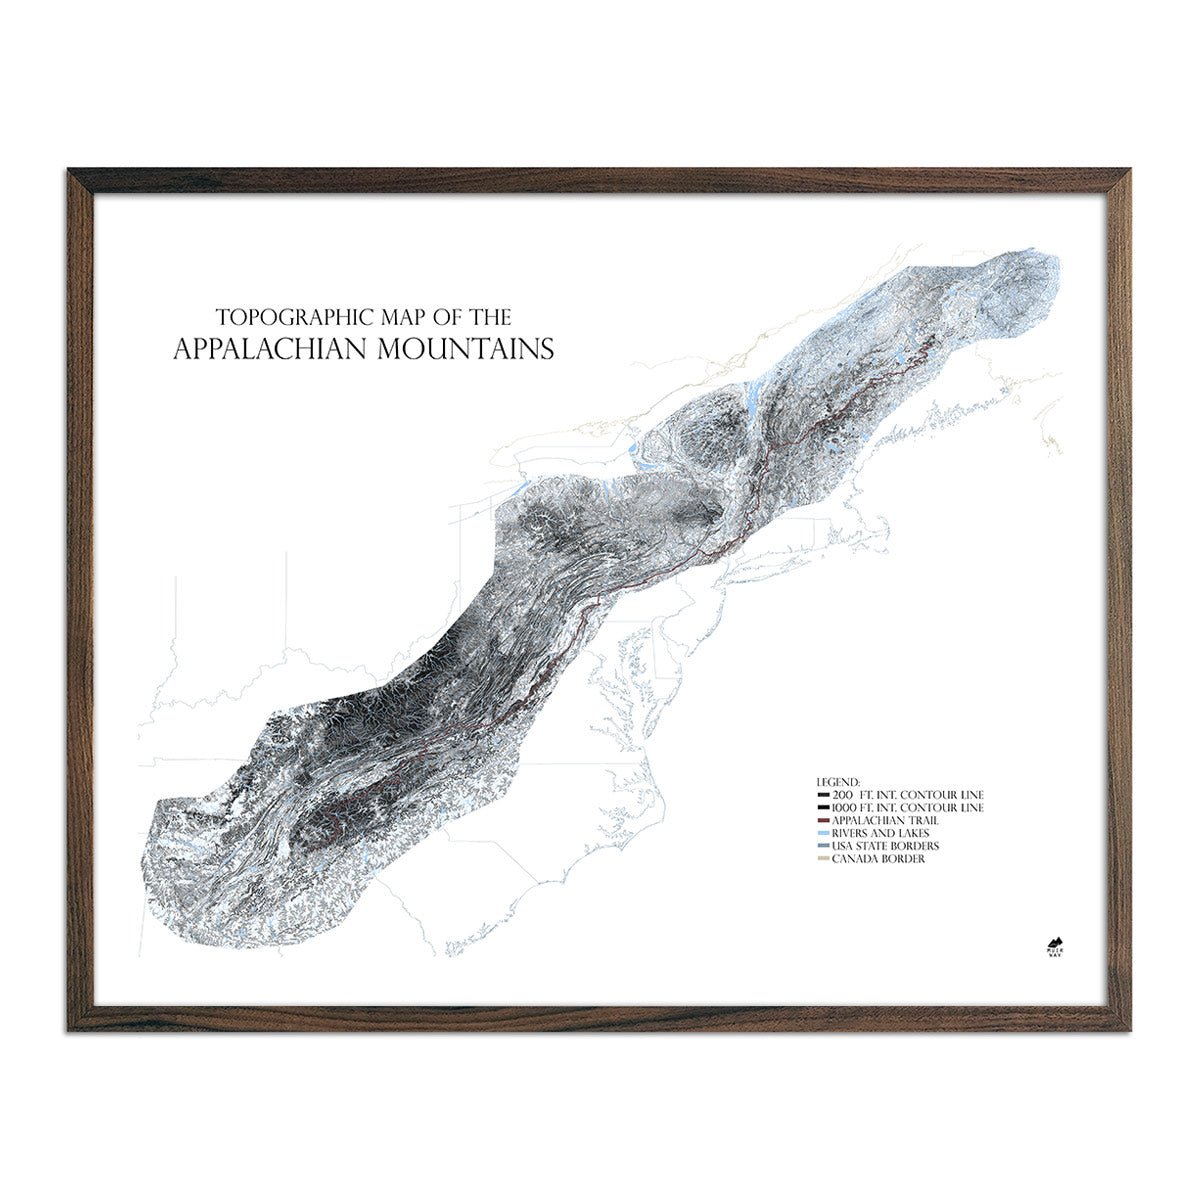
Contour lines
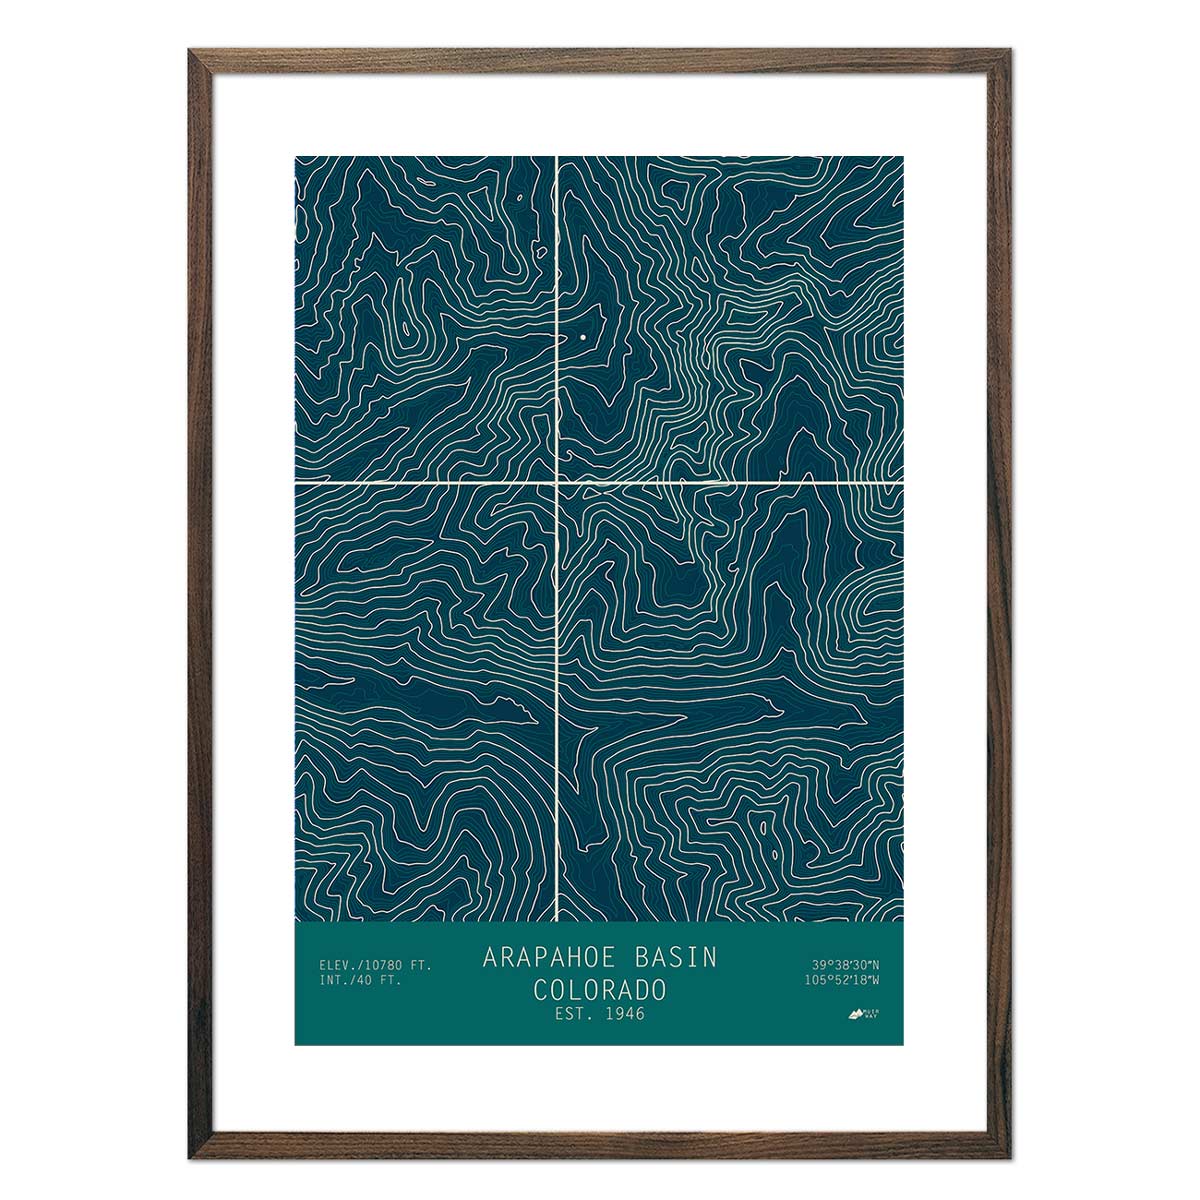
Contour lines are all the small, squiggly lines found on a topographic map. These are the cornerstone of a topographic map, and connect points with the same elevation above or below sea level. These lines allow cartographers to depict a three dimensional landscape on a flat paper map:

Closely packed contour lines means steep slopes are present – as contour lines get closer together, the rate of change in elevation is increasing.
Loosely packed contour lines means the terrain is slowing down in terms of elevation, and depicts areas with a gentler slope.
Contour lines that cross rivers will bend in the upstream direction, with the tip of the V pointing towards the source of the water – the actual flow of the water will be the opposite direction.

Concentric circles of lines represent mountain peaks on a topo map, with the peak being the smallest circle. If the summit has been properly surveyed, some of these will have the exact elevation listed along the line.

Every fifth line will appear thicker – these are called contour index lines, and along this line you’ll find the elevation marked with a number. Maps will list the change in terrain elevation between contour lines, and this small change in elevation is called a contour interval. For example, if a map’s contour line interval is 50 feet, each space between a line represents 50 feet of elevation change.

Contour intervals remain the same size between each index line, even if the distance between the contour lines may change between lower and higher elevations. Always pay attention to the contour interval notation of your maps, as it makes navigating the rest of it a breeze. Tick marks on contour lines in general point towards lower elevations.
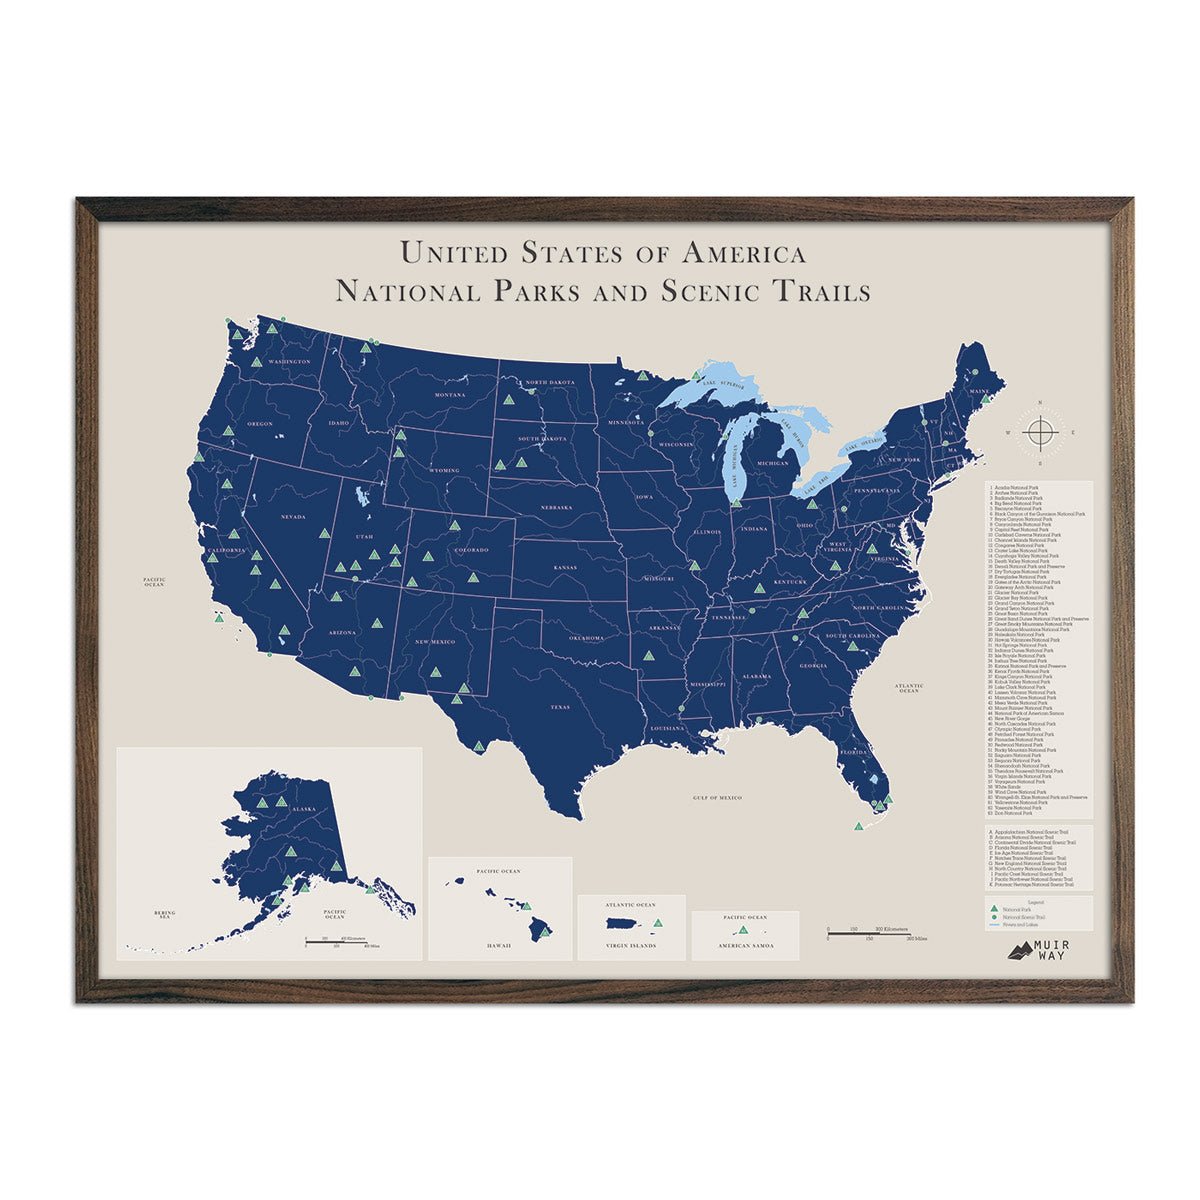
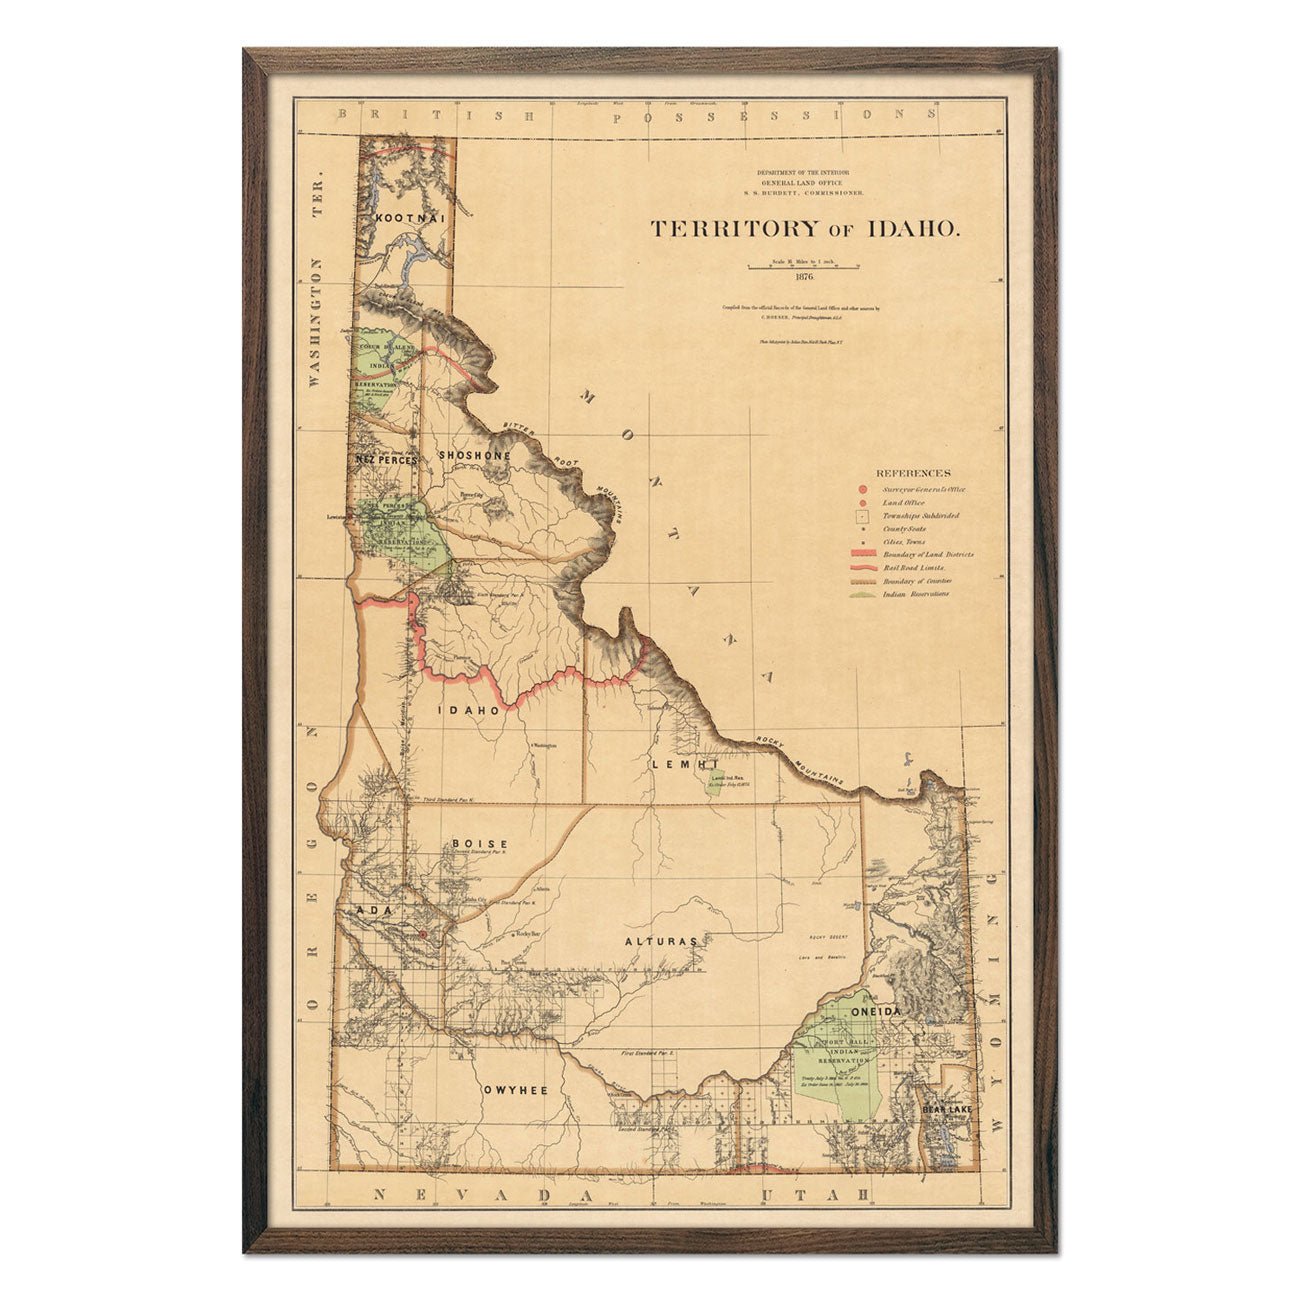
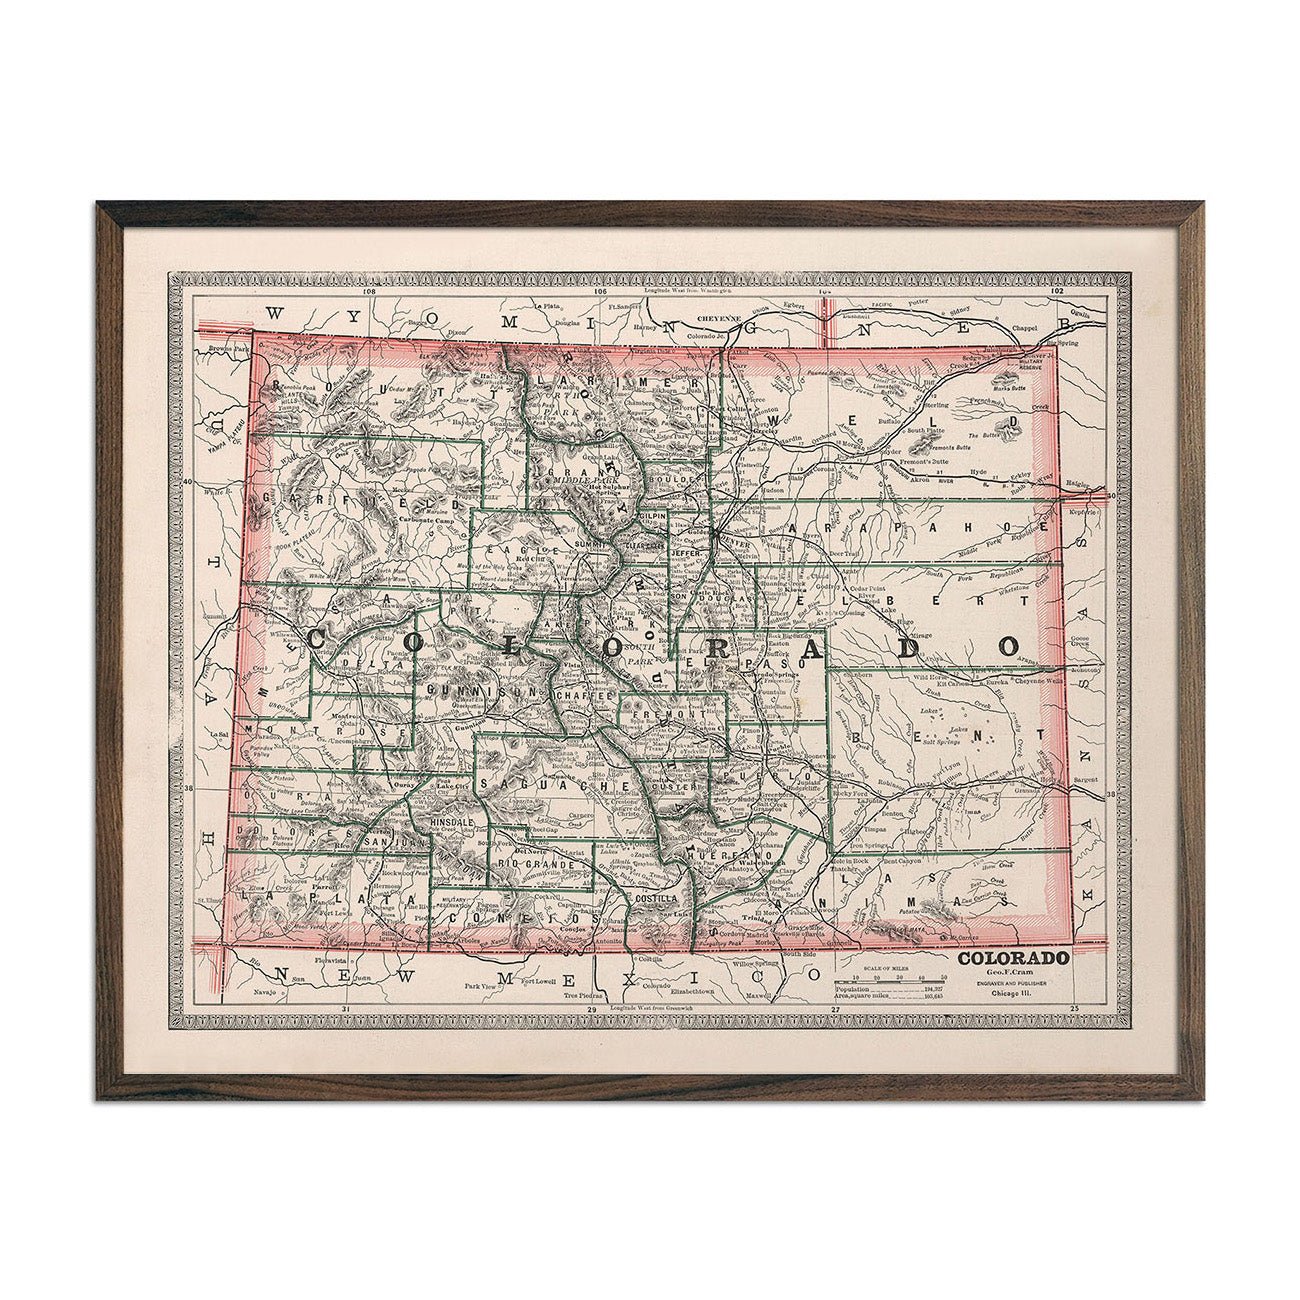
Map legends
A map’s legend will list a number of symbols to be aware of, usually representing things like roads, cities and towns, and other landmarks. Of course, this will all depend on why the map was created: many maps used for research will have more symbols present than more artistic maps made for those with an eye for aesthetics.
Different organizations may even use unique symbols. The United States Geological Survey (USGS), for example, uses a variety of symbols that aren’t exactly standardized, although plenty are shared among similar organizations across the world. Your average topo map will feature things like:
-
Dates in which a map was published or updated – roads, trails, and boundaries can change
-
Declination, which allows you adjust your compass depending on where you are
-
Location, usually in the form of a quadrangle grid which shows any regions nearby
-
Map scale and topographic coordinates
-
A guide to the map's magnetic north and true north
The USGS keeps a few updated topo map symbol sheets you can check out if you want.
Map scales
Similar to a map legend, the scale of a topo map is usually listed at the bottom. The numbers given represent the relative scale of the area depicted; for example:
Scale: 1:15000
In this case, a scale of 1 to 15,000 means 1 inch on the map actually represents 15,000 inches. A map with a massive scale will most likely show less detail than a smaller scale map – so, if you’re looking for a super detailed, highly accurate map of your hometown you’ll want to go with a smaller topographic map.
Near the scale conversion, you may also spot another scale showing how large one to two miles or kilometers are on your map in the context of the provided line. This allows you to estimate how far away a landmark may be from your current location while hiking or relaxing at home.
Topographic coordinates
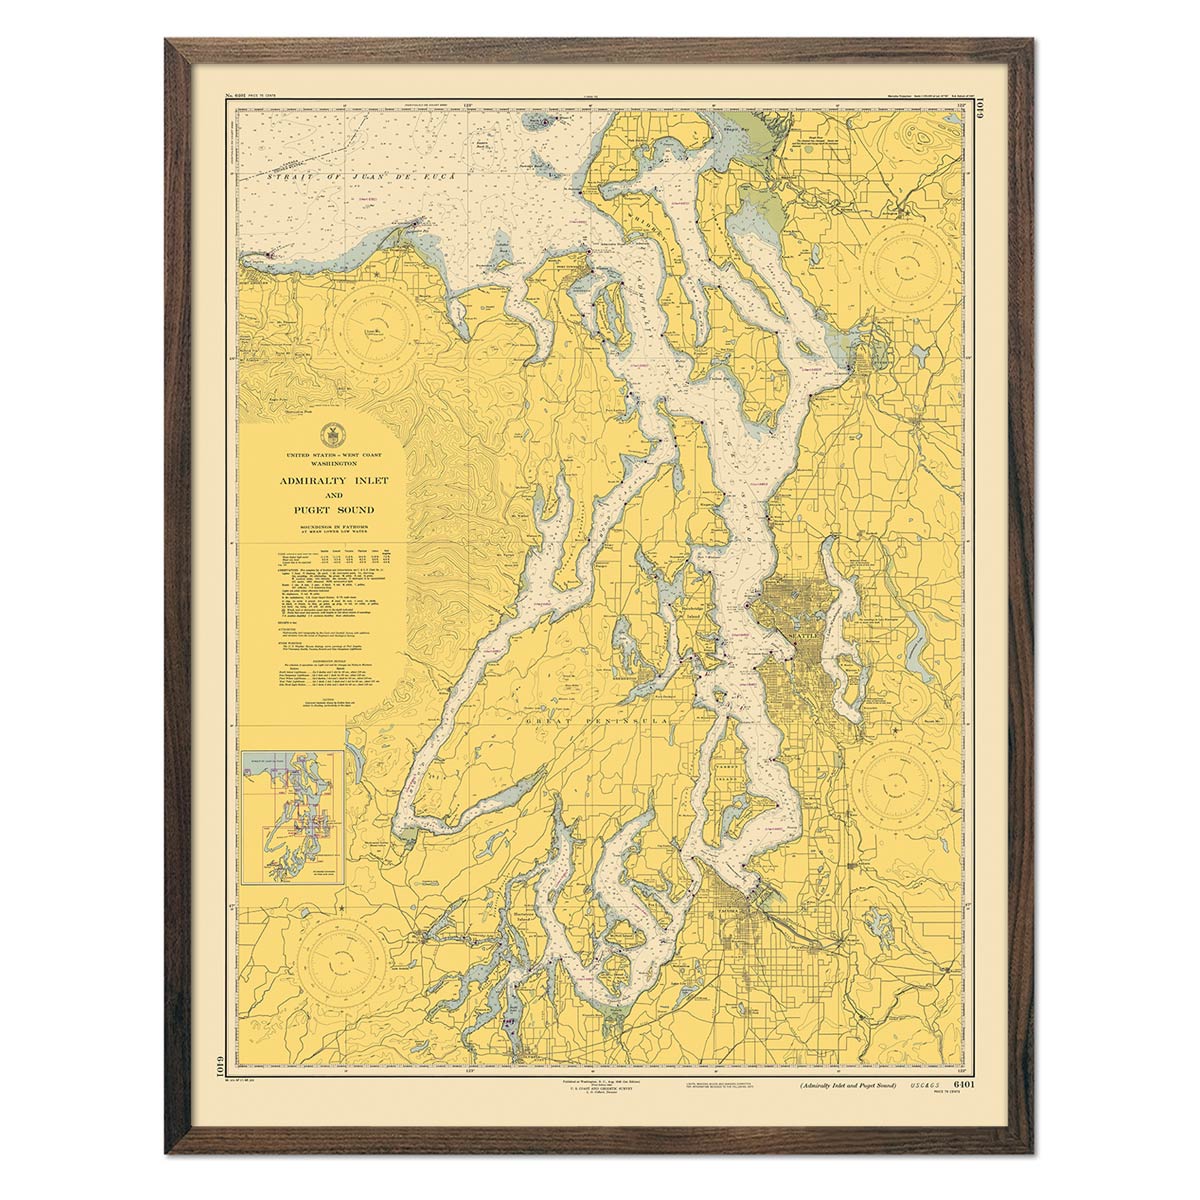
Along the edges of a topo map, you may come across a handful of topographic coordinate numbers listed in different areas. These numbers are there for a few reasons, one of which is to allow the use of a compass when navigating:
The corner numbers represent the latitude and longitude of the corner.
The side-edge numbers represent the UTM grid lines, also known as the Universal Transverse Mercator coordinate system. A bit confusing, but their purpose is simple: they assign horizontal coordinates to various locations on Earth as if it was flat, ignoring altitude.
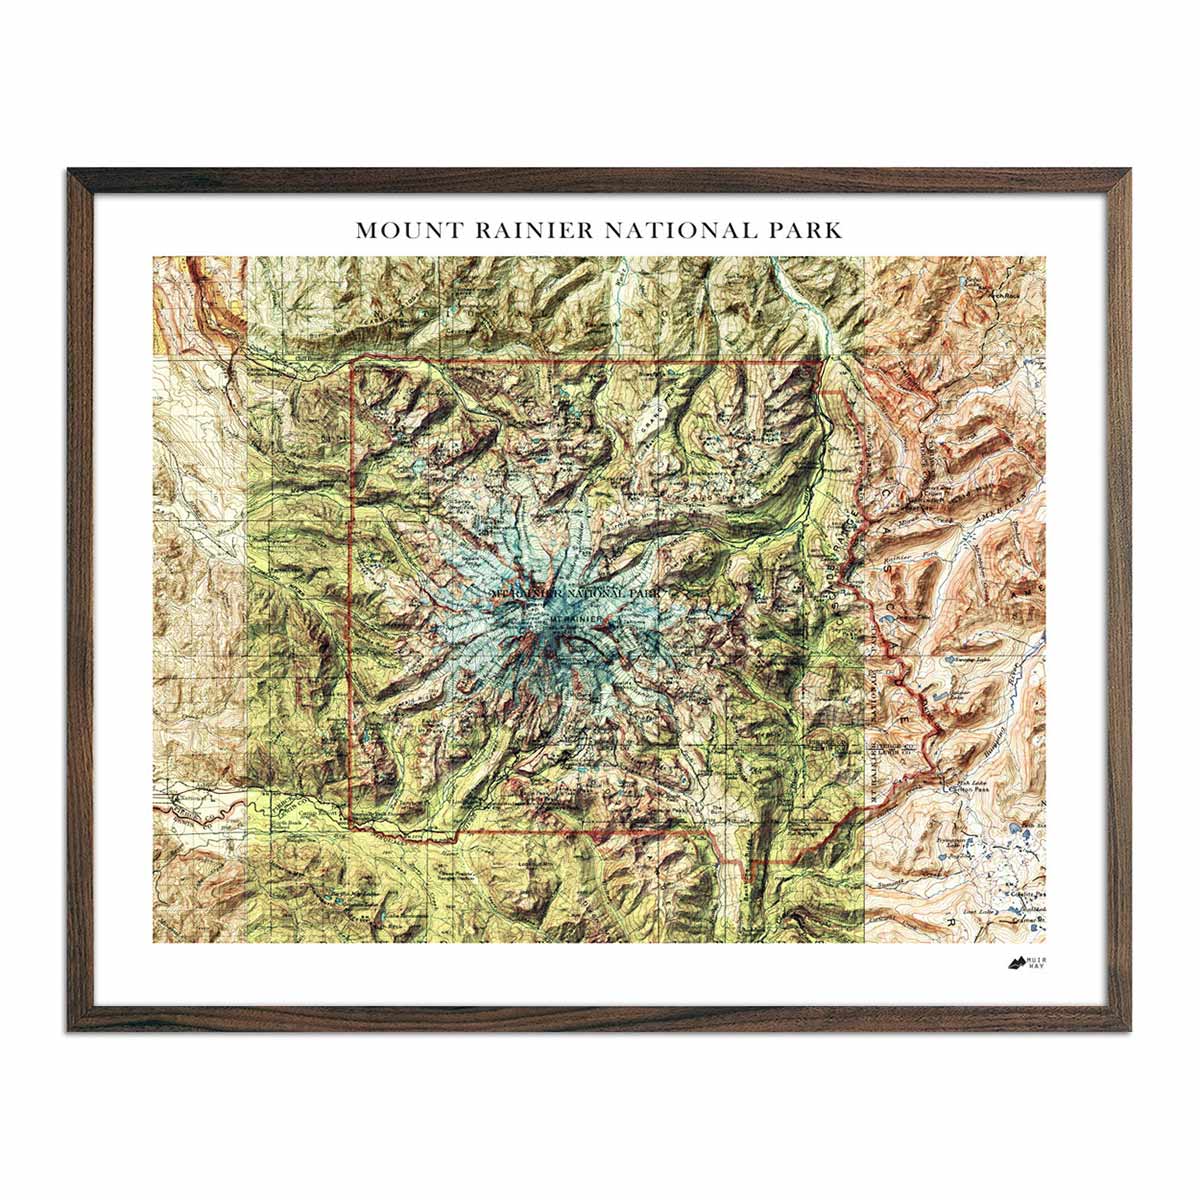
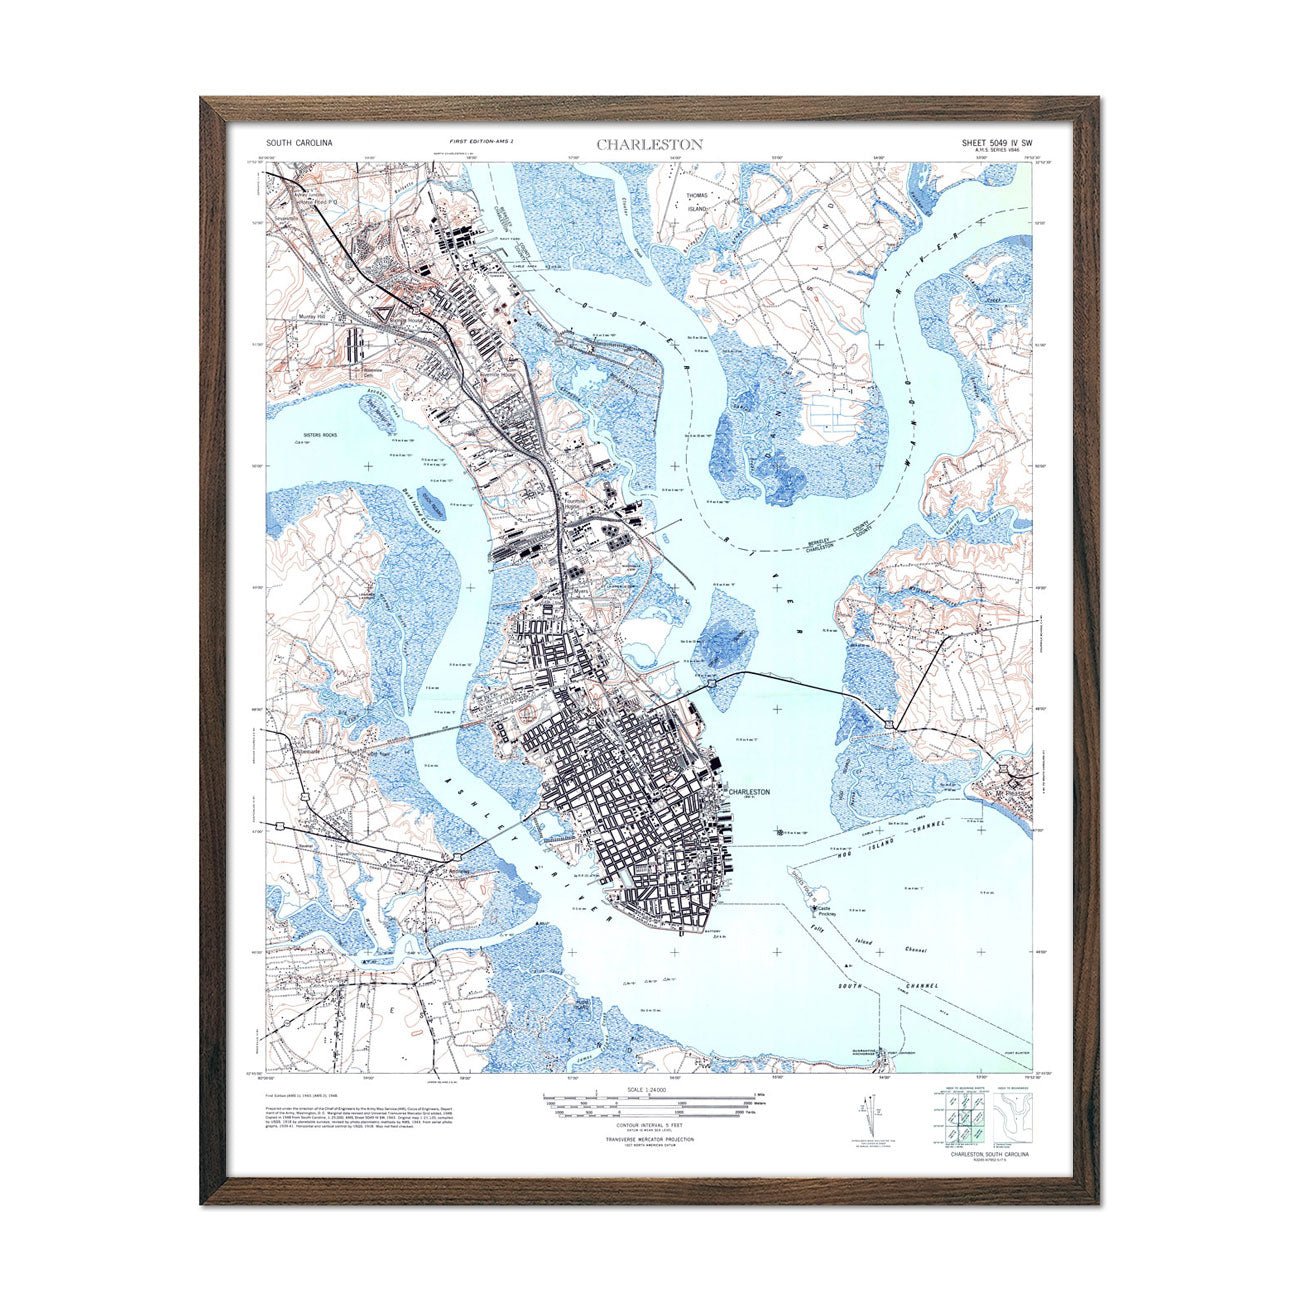
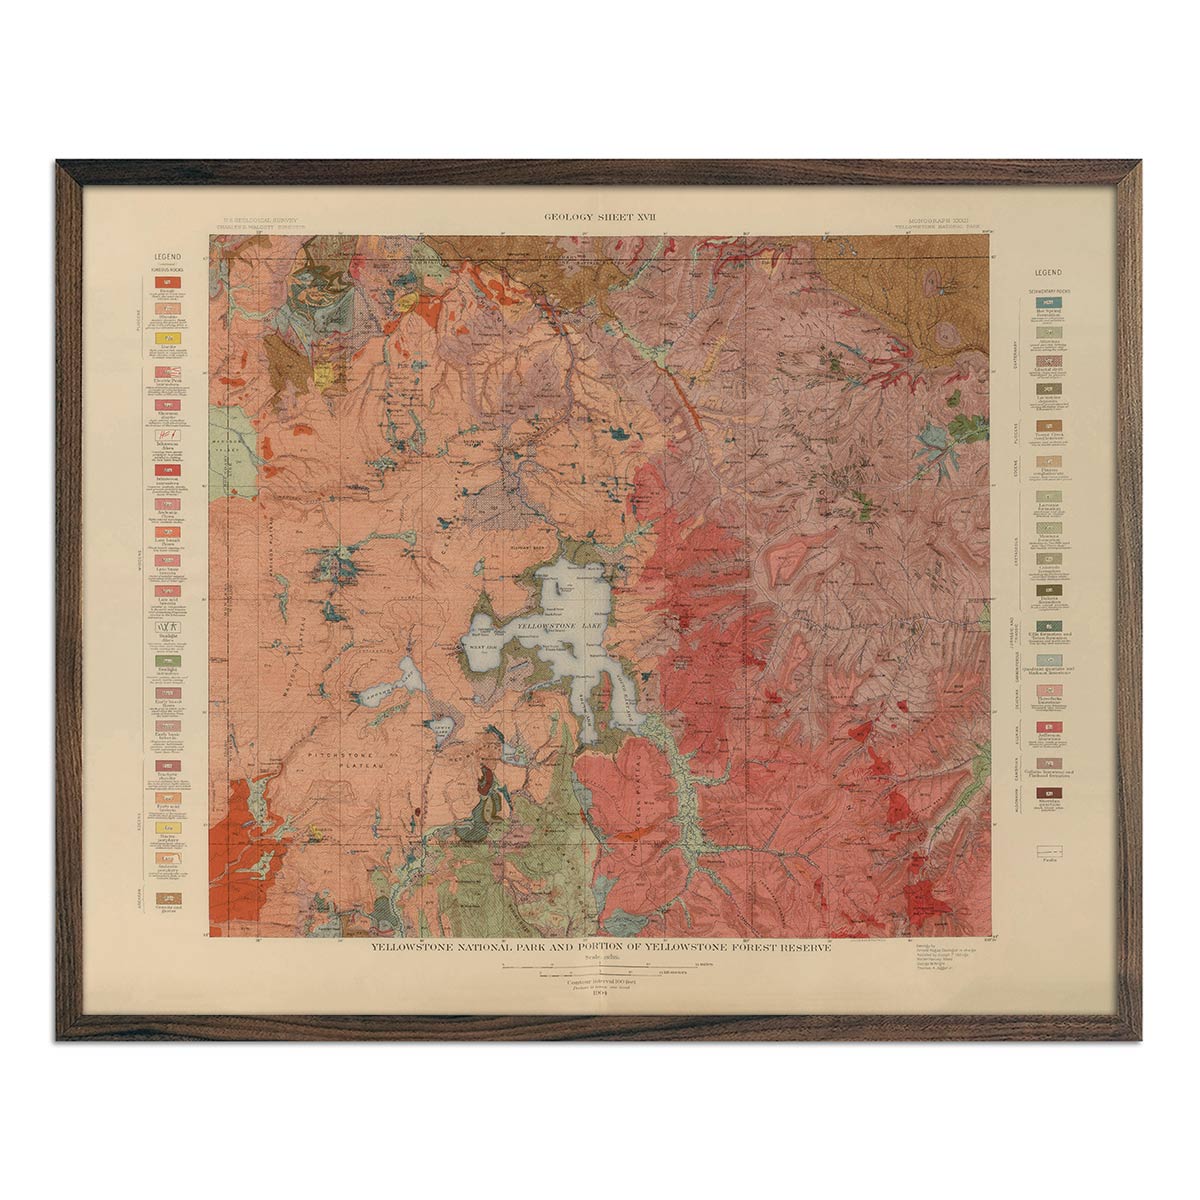
Colors on the map
Across all the categories mentioned above, you’ll come across a handful of colors on many topographic maps. These may change depending on the source of the map, but here’s a short list covering the meanings of these colors according to the USGS:
-
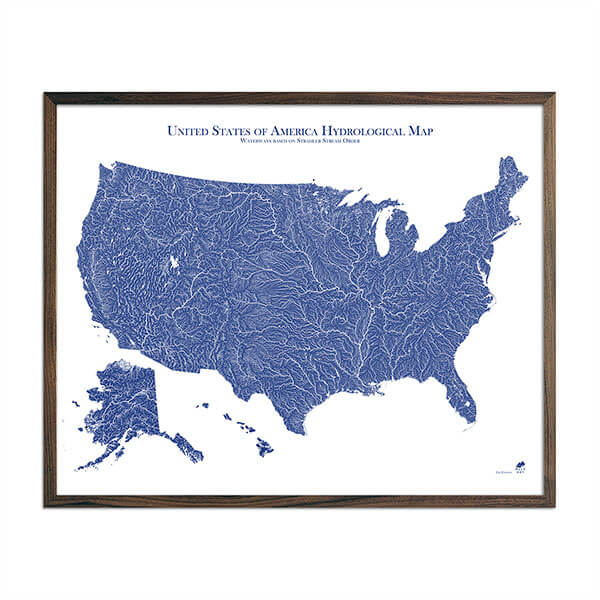
Blue lines: aquatic features like rivers, lakes, and dams
-
Green lines: vegetation like national forests and tall tree cover
-
White lines: usually areas without tall vegetation, like grass or desert
-
Red lines: highways, survey lines, and boundaries
-
Brown lines: contour lines, UTM grid lines, and elevation
-
Black lines: human structures, trails, and names of places
Usually, denser vegetation and forest cover will be depicted using thicker contour lines, with areas of sparse vegetation drawn using thinner lines.
What are the six rules for reading a topographic map?
Reading a map can be confusing, but there are six rules that you can focus on following if you’re having a bit of trouble or just need a refresher:
-
Contour lines that are closer together mean the slope is steeper; lines that are spread out mean it’s a gentle slope
-
Circles of contour lines that get smaller and smaller represent the peaks of mountains.
-
Contour lines will never cross – lines are also always seen from above
-
Contour lines won’t end in the middle of a map, they’ll either form a peak or run off the edges
-
Water flowing upstream will be accompanied by a bent contour line, with the V shape facing the water’s source. In real time, water will flow the opposite direction downhill
-
The elevation of the peak will be less than the value of what an additional contour line would add; for example: If the last line is 100 feet of elevation, and the contour line interval is 50 feet, the highest the peak could be is 149 feet
What if I'm a fan of minimalist topographic maps?
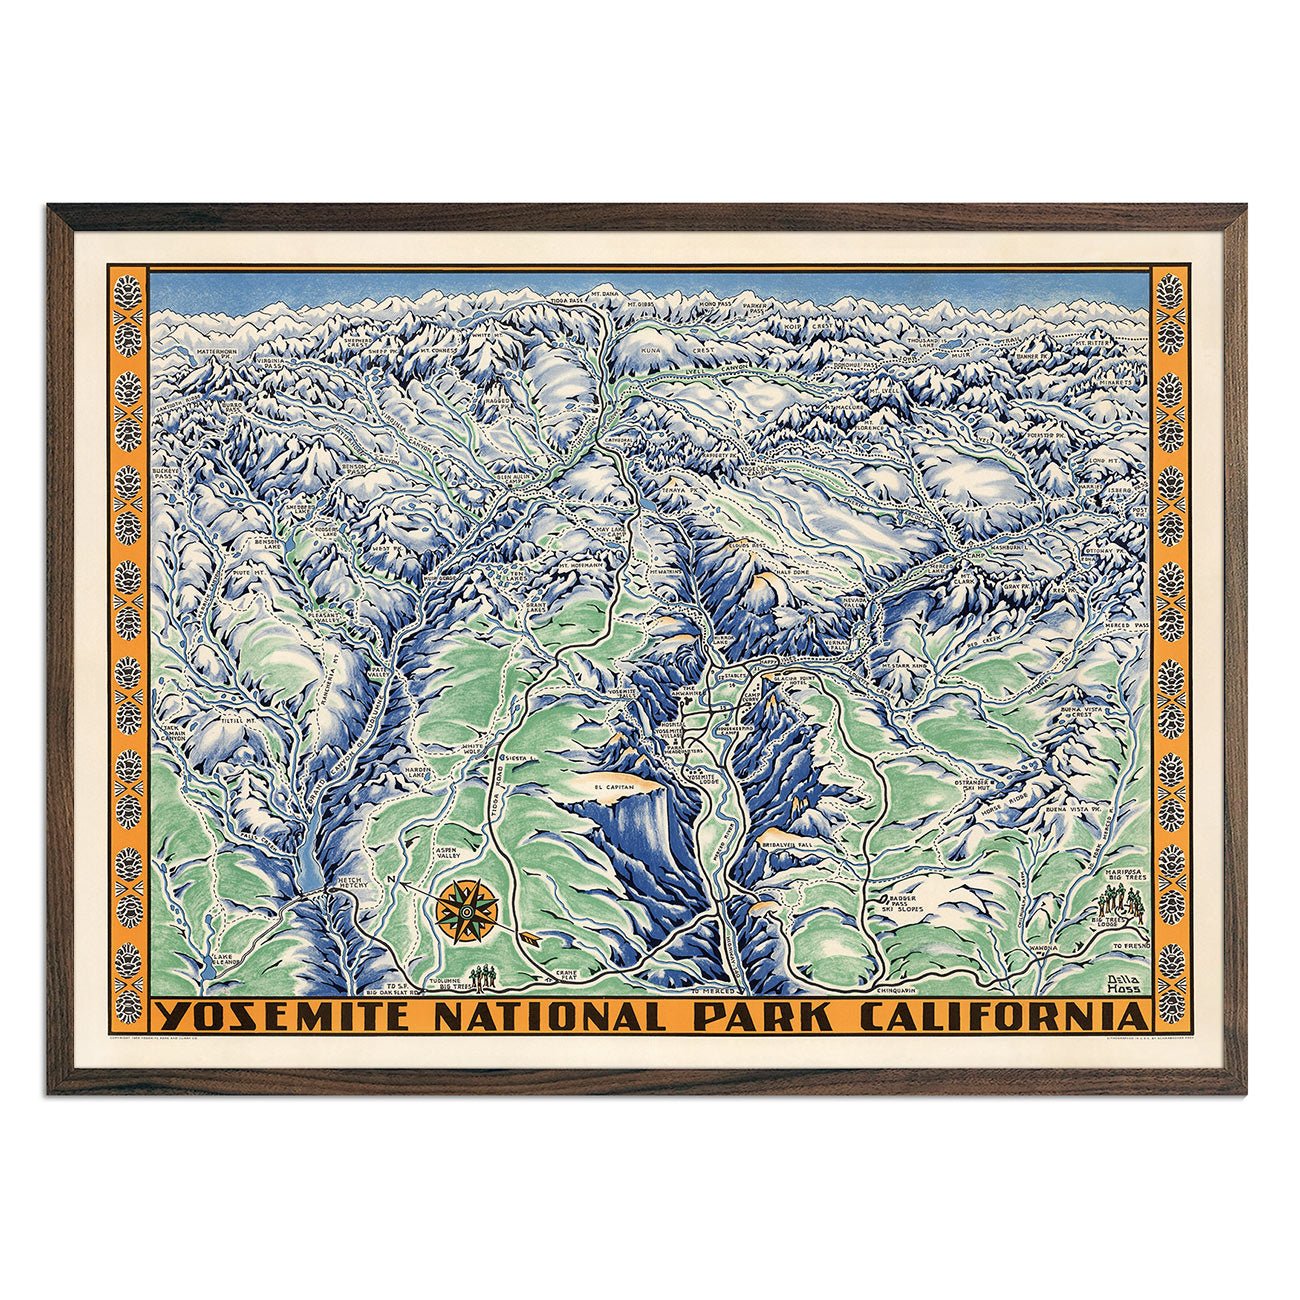
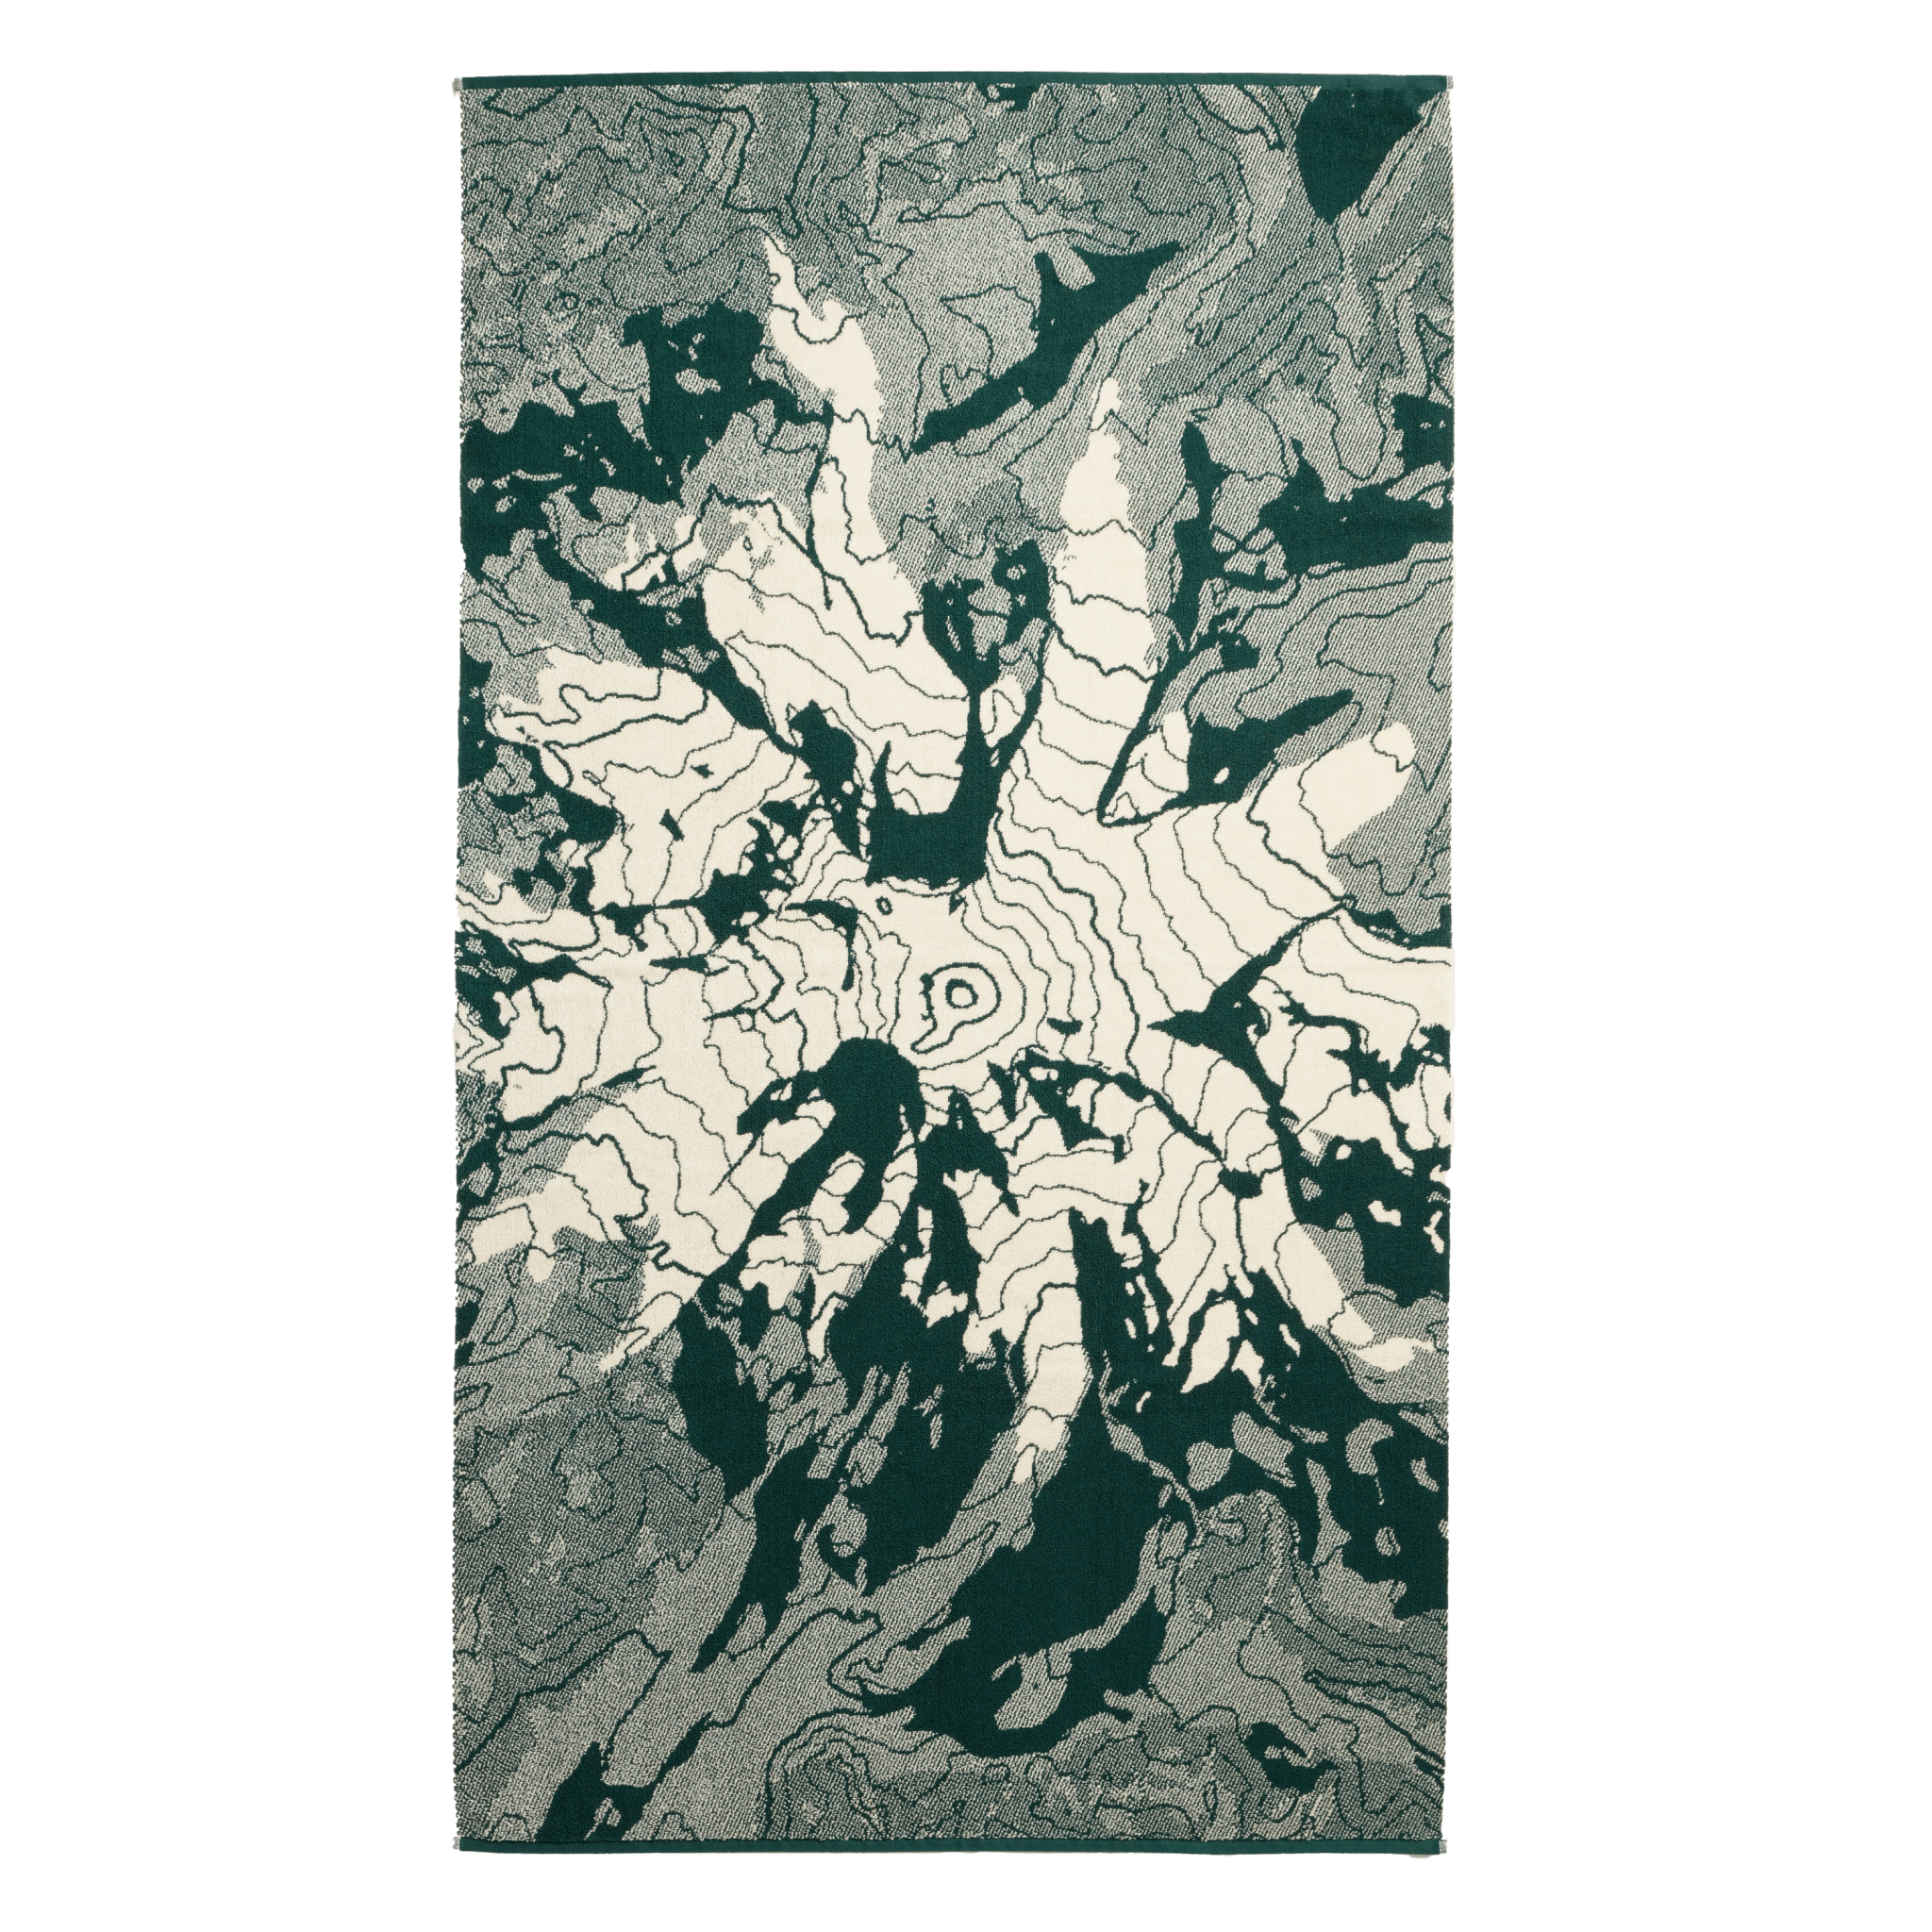
Not everyone wants a topo map because they’re trying to navigate with a compass. There’s an entirely different side to these maps: they’re really quite beautiful. These maps are considered scientific works of art by many, and as interior design trends shift towards more natural, botanical, and eclectic styles, topo maps are starting to catch on.
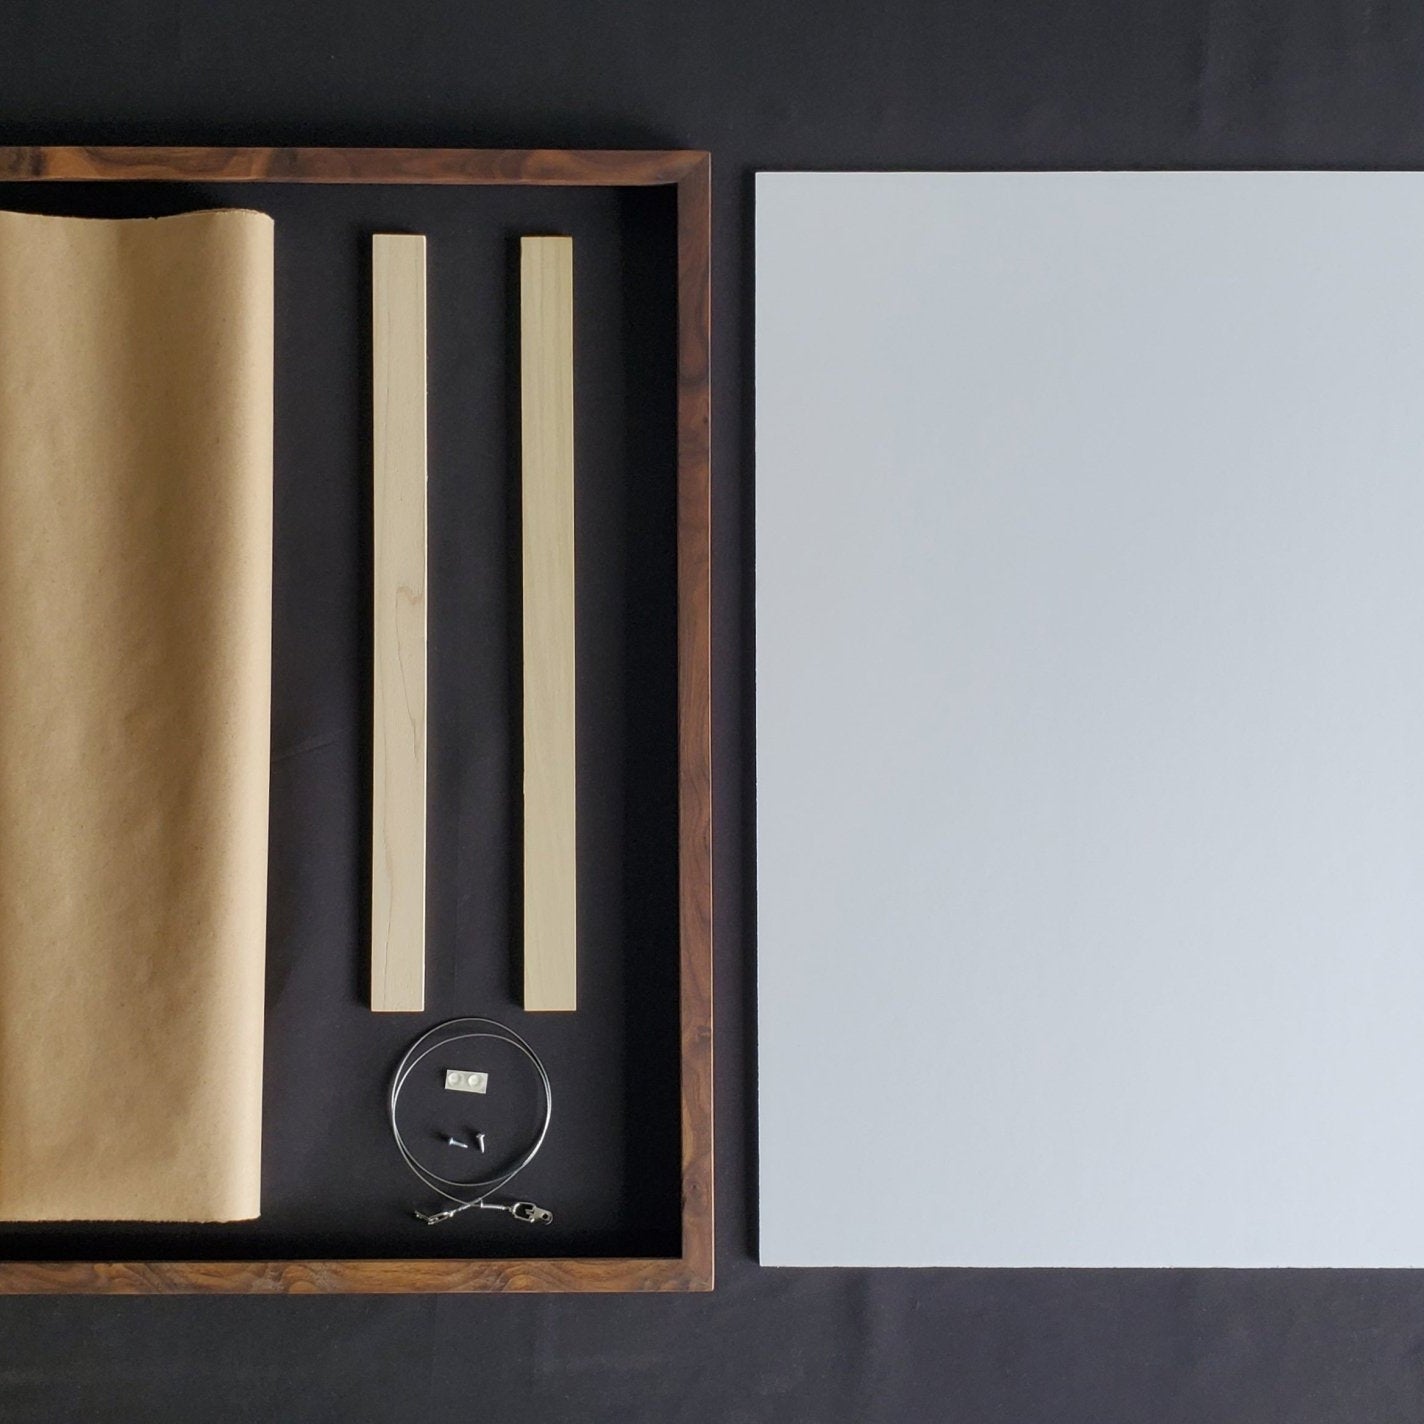
If you’re looking for a piece of art, you’ve come to the right place. Our topographic art series is designed with map-making in mind using USGS data, while showing off the artistic aspects of cartography so many appreciate. Stylized maps feature streamlined design elements, reduce the amount of text clutter and white space, and use a variety of aesthetic colors that won’t clash with the rest of your home’s color palette.
Here are a few map examples that may catch your eye, especially if you ski or snowboard:
-
Mount Bachelor, Oregon: a highly-contoured map of one of the most famous ski resorts in the world.
-
Jackson Hole, Wyoming: a simple but elegant depiction of Wyoming’s top snowboard destination
-
Killington, Vermont: a stylized version of a popular lodge and camping spot in Vermont
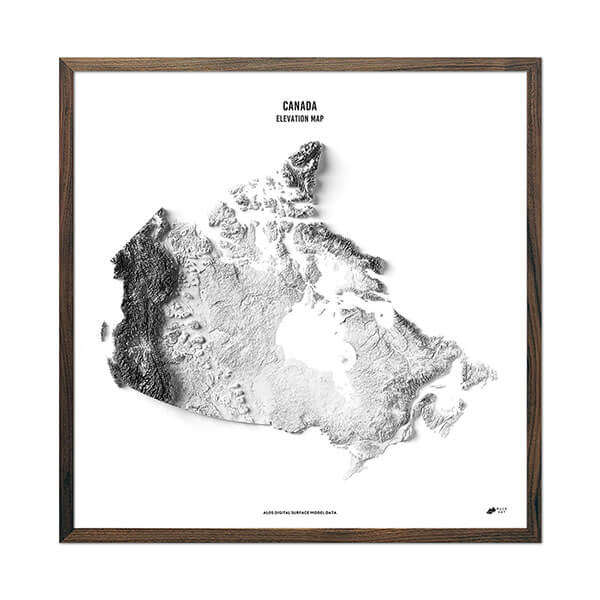
If you want a map depicting elevated peaks without any lines at all, make sure to browse our series of elevation maps as well. Our relief series maps are similar, but combine contour and elevation data, serving as both decoration and hiking aids.
Can you use topographic maps in real life?
Topographic maps aren’t only useful to scientists in the lab or as artwork – you can actually use these maps, or at least certain versions of them, while enjoying some of your favorite hobbies like hiking or camping. If you want to navigate using a topographic map on your next backpacking trip, you’ll need a compass.
Once you have a compass and a map, all you really have to do is practice, study, and implement what you’ve learned here in the field. Easier said than done, but this guide should provide enough for any aspiring wanderer to make use of a topo map in the real world.
If you’re more of a visual learner, or prefer videos, you may want to take a peak at Outside Chronicle’s video on basic land navigation using topographic maps. We also loved HikingGuy’s video on the same topic, which goes in-depth on how to use Google Maps as a complimentary resource!
Final thoughts
These maps are both works of art and useful scientific tools. Without them, most modern industries that rely on geological or elevation data would be lost.
By learning how to read a topographic map, you'll be able to understand how certain industries function using data – and you may even find yourself a new addition for the walls of your living room or office.