


When it comes to understanding our planet's complex geological history, maps play a crucial role. Yes, even today - in the era of GPS and other technological advancements, geological maps still have their place.
Wait, what are geological maps, though? What do they tell you? And more importantly, how do you read them? Below, we’ll answer all these questions and many others you may have about this topic.
Maybe you’ve seen one of these maps already and have been captivated by its colorful patterns, but baffled by the complex symbols and markings. You’re not alone - while these can be intricate, we’re here to demystify them for you.
Whether you're a student, a hiker, a historian, or simply a curious soul, understanding geological maps can unlock a world of insights about the Earth beneath our feet. And now, you’re just a few moments away from feeling confident in your ability to interpret their symbols and understand the fascinating stories they tell about a region's geological history.
What are Geological Maps?
Geological maps are a fundamental tool in earth sciences that offer a bird's-eye view of the geological features and structure of a specific region. They do more than merely depict the landscape. They go a step further, peeling back the surface layer to expose what lies beneath our feet.
Geological Maps Definition
By definition, a geological map represents the distribution of different types of rock and unconsolidated material, such as soil or gravel, at the Earth's surface within a specific area.
But it's more than just a map. It's a visualization of the geological history of that area, providing insights into the ancient processes that have shaped the terrain over millions of years.
The unique feature of geological maps is that they convey three types of information:
- They show the horizontal distribution of rocks and sediments, much like a standard map showing roads and towns.
- They portray the type of rocks and their age, which gives insight into the historical geology of an area.
- They give an indication of the subsurface rock formations and their orientation, helping understand the structural geology of a region.
Now, the question is, why is all this valuable - especially in this day and age?
What are Geological Maps Used For, Exactly?
The uses of geological maps are manifold, ranging from academic research to practical applications in various industries. Here are a few key ways they're utilized:
- Scientific Research: Geological maps are essential for understanding the Earth's history and the geological processes that have shaped its surface. They are fundamental tools in the study of geology and are used for research in earth sciences, climate studies, and environmental sciences.
- Natural Resources Exploration: Industries such as mining, petroleum, and natural gas extensively use geological maps to locate deposits of minerals, oil, and gas. They can identify areas where the rock types indicate the likely presence of these resources.
- Land Use and Planning: When planning the construction of infrastructure like roads, dams, or buildings, geological maps help engineers understand the stability of the ground and the risk of natural hazards like landslides or earthquakes.
- Education: Geological maps are invaluable teaching aids, helping students visualize and understand complex geological concepts and processes.
- Outdoor Recreation: Hikers, climbers, and outdoor enthusiasts often use geological maps to understand the terrain they will be navigating and appreciate the natural landscape.
In essence, geological maps serve as a key to unlocking our understanding of the Earth's past, guiding our exploration of its resources, and helping us navigate its diverse and often challenging terrain. They bridge the gap between our experience of the landscape at the surface and the hidden geological processes that have crafted that landscape over eons.
How Are Geological Maps Made?

The creation of geological maps is an intricate process that requires a blend of fieldwork, analysis, and cartographic skills. The journey from the bare landscape to a colorful, detail-filled geological map involves three main stages: fieldwork and data collection, data analysis, and map design and creation.
Fieldwork and Data Collection
The first stage of creating a geological map starts on the ground. Geologists equipped with hammers, compasses, GPS devices, and notebooks venture out into the field to directly observe and record geological features.
They walk the landscape, examine outcrops, take measurements, and record observations to understand the types of rocks present, their distribution, orientation, and relationship to each other.
Fieldwork also involves collecting rock samples that can be analyzed further in a laboratory. Additionally, geologists might use remote sensing data from satellites or drones to complement their field observations. This is especially common in areas that are inaccessible or too large to cover on foot.
In certain instances, subsurface information from boreholes and seismic surveys is used to infer the underground geology.
Data Analysis
Once the field data is collected, the next stage involves its analysis and interpretation. This step often takes place back in the laboratory, where rock samples are studied under microscopes, and their chemical composition is determined.
The collected data is used to interpret the geological history of the area, including the nature of the rocks, their age, the sequence of events that led to their formation, and the geological processes involved.
Technological advancements have introduced tools such as Geographic Information Systems (GIS) that enable geologists to manage, analyze, and visualize the data they've collected. They can create digital models, manipulate datasets, and overlay different types of information to make informed interpretations about the geological history of the area.
Map Design and Creation
The final phase is what excites us the most: actually designing and creating the map itself. This involves translating the data and interpretations into a visual format. Using cartographic techniques, the map is drawn to scale, and different types of rocks and geological features are represented by specific colors, patterns, and symbols as defined by the map legend.
In this stage, technology plays a critical role. Software applications allow for the production of digital maps that can be easily updated, customized, and shared. These digital geological maps can also be integrated with other types of maps, creating layered, interactive maps that can be explored in 3D.
How to Read Geological Maps to Gain Key Insights on a Region

Geological maps are rich in information - that is well-established. But to unlock their secrets, one must understand how to read and interpret them.
Just like learning a new language, getting familiar with the various symbols, colors, and conventions used on these maps will allow you to gain key insights into a region's geological characteristics and history. We’ll guide you through this below, leaving you completely confident in how to read geological maps to gain key insights.
Understanding the Map Legend
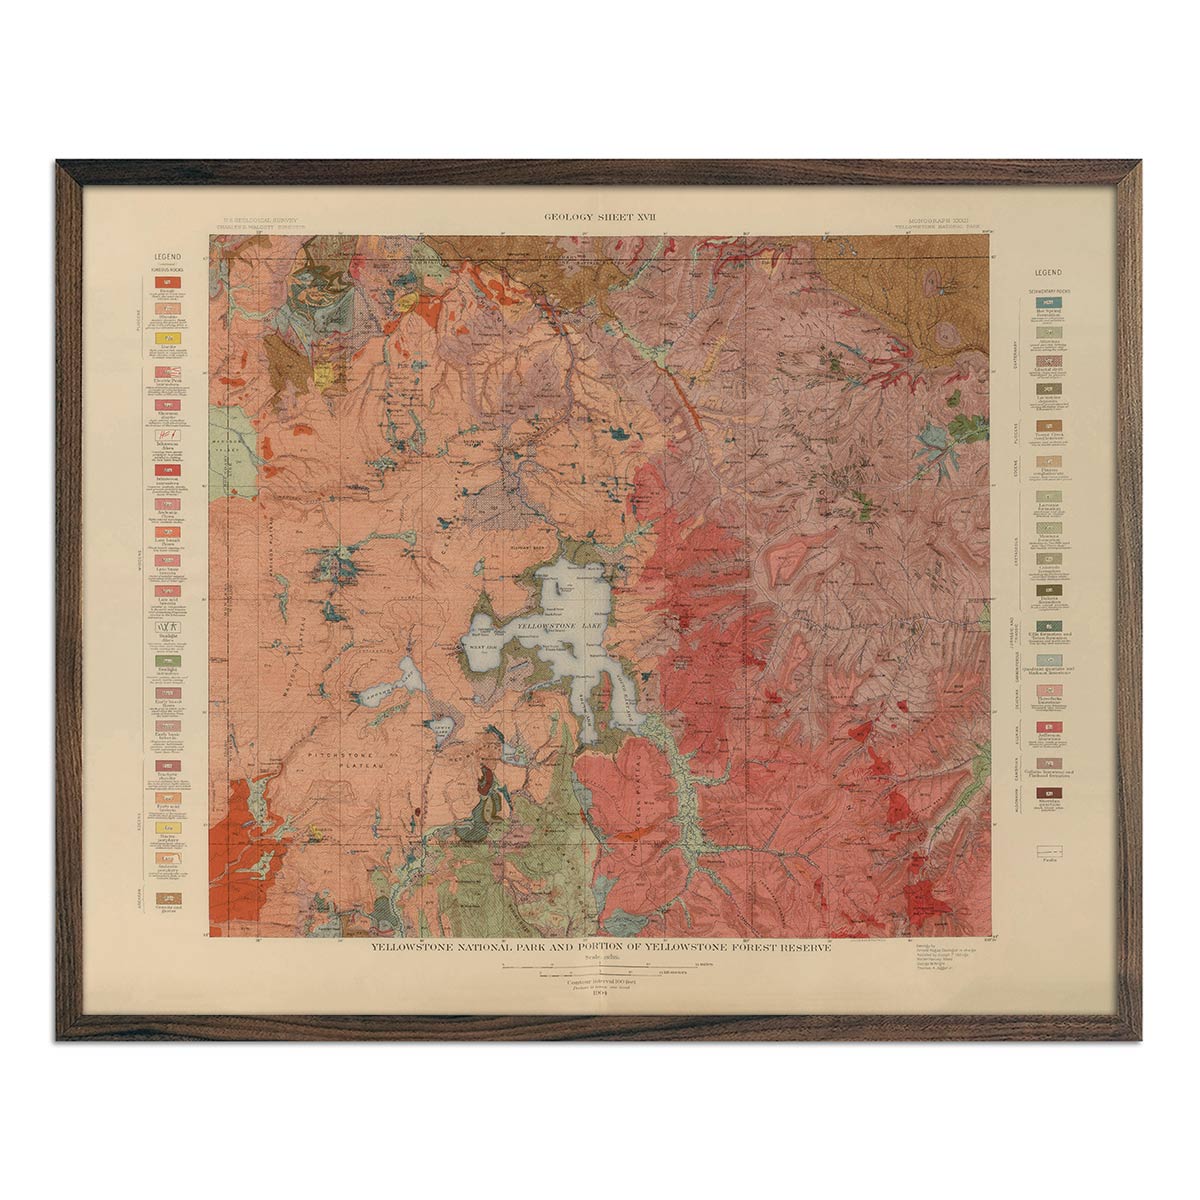
The map legend, often found in a corner of the map, is your primary guide to deciphering a geological map. The legend details what each color, symbol, and line type on the map represents.
Typically, colors are used to represent different rock types or geological units. These colors can either be arbitrary or based on a set of standard colors like the one set by the Commission for the Geological Map of the World (CGMW). Usually, the same kind of rock or similar ages of rocks are assigned the same color across different maps.
Key Symbols & Their Meanings
Various symbols are used on geological maps to indicate specific features or observations. For instance, strike and dip symbols are used to show the orientation of rock layers or fault planes. A small line (the "strike") represents the direction the rock layer runs across the surface, while a number (the "dip") tells you how steeply the rock layer is tilting from the horizontal.
Other symbols might represent the location of fossils, mineral occurrences, or sample sites. Often, different types of lines are used to represent different kinds of geological boundaries or structures like faults, folds, or the edge of a glacier or an old shoreline.
Interpreting Geological Features: Faults, Folds, and Rock Units
Understanding how to interpret common geological features such as faults, folds, and rock units is also vital when reading geological maps.
- Faults: Faults are fractures in the Earth's crust along which movement has occurred. On a map, they are often represented as lines, with specific symbols indicating the type of fault (normal, reverse, strike-slip) and the direction of movement.
- Folds: Folds are bends in rock layers due to compressional forces. They can be seen on maps as wavy lines of rock units, with symbols indicating the direction of younging. Anticlines (upward folds) and synclines (downward folds) are the most common types of folds.
- Rock Units: These are distinct volumes of rock of a particular origin and age range. They are depicted with different colors or patterns, with labels usually indicating the age and the type of rock.
Reading a geological map involves correlating the symbols and colors with their meanings in the legend, understanding the relationship between different rock units and geological structures, and ultimately visualizing the 3D structure of the geology beneath the flat map.
The more you work with geological maps, the more comfortable you will become in interpreting the stories they hold of the Earth's past. Now that you know how to read geological maps, why not appreciate your very own up close and personal?
Celebrate the Wonder of Geological Maps With Reproductions at Muir Way!

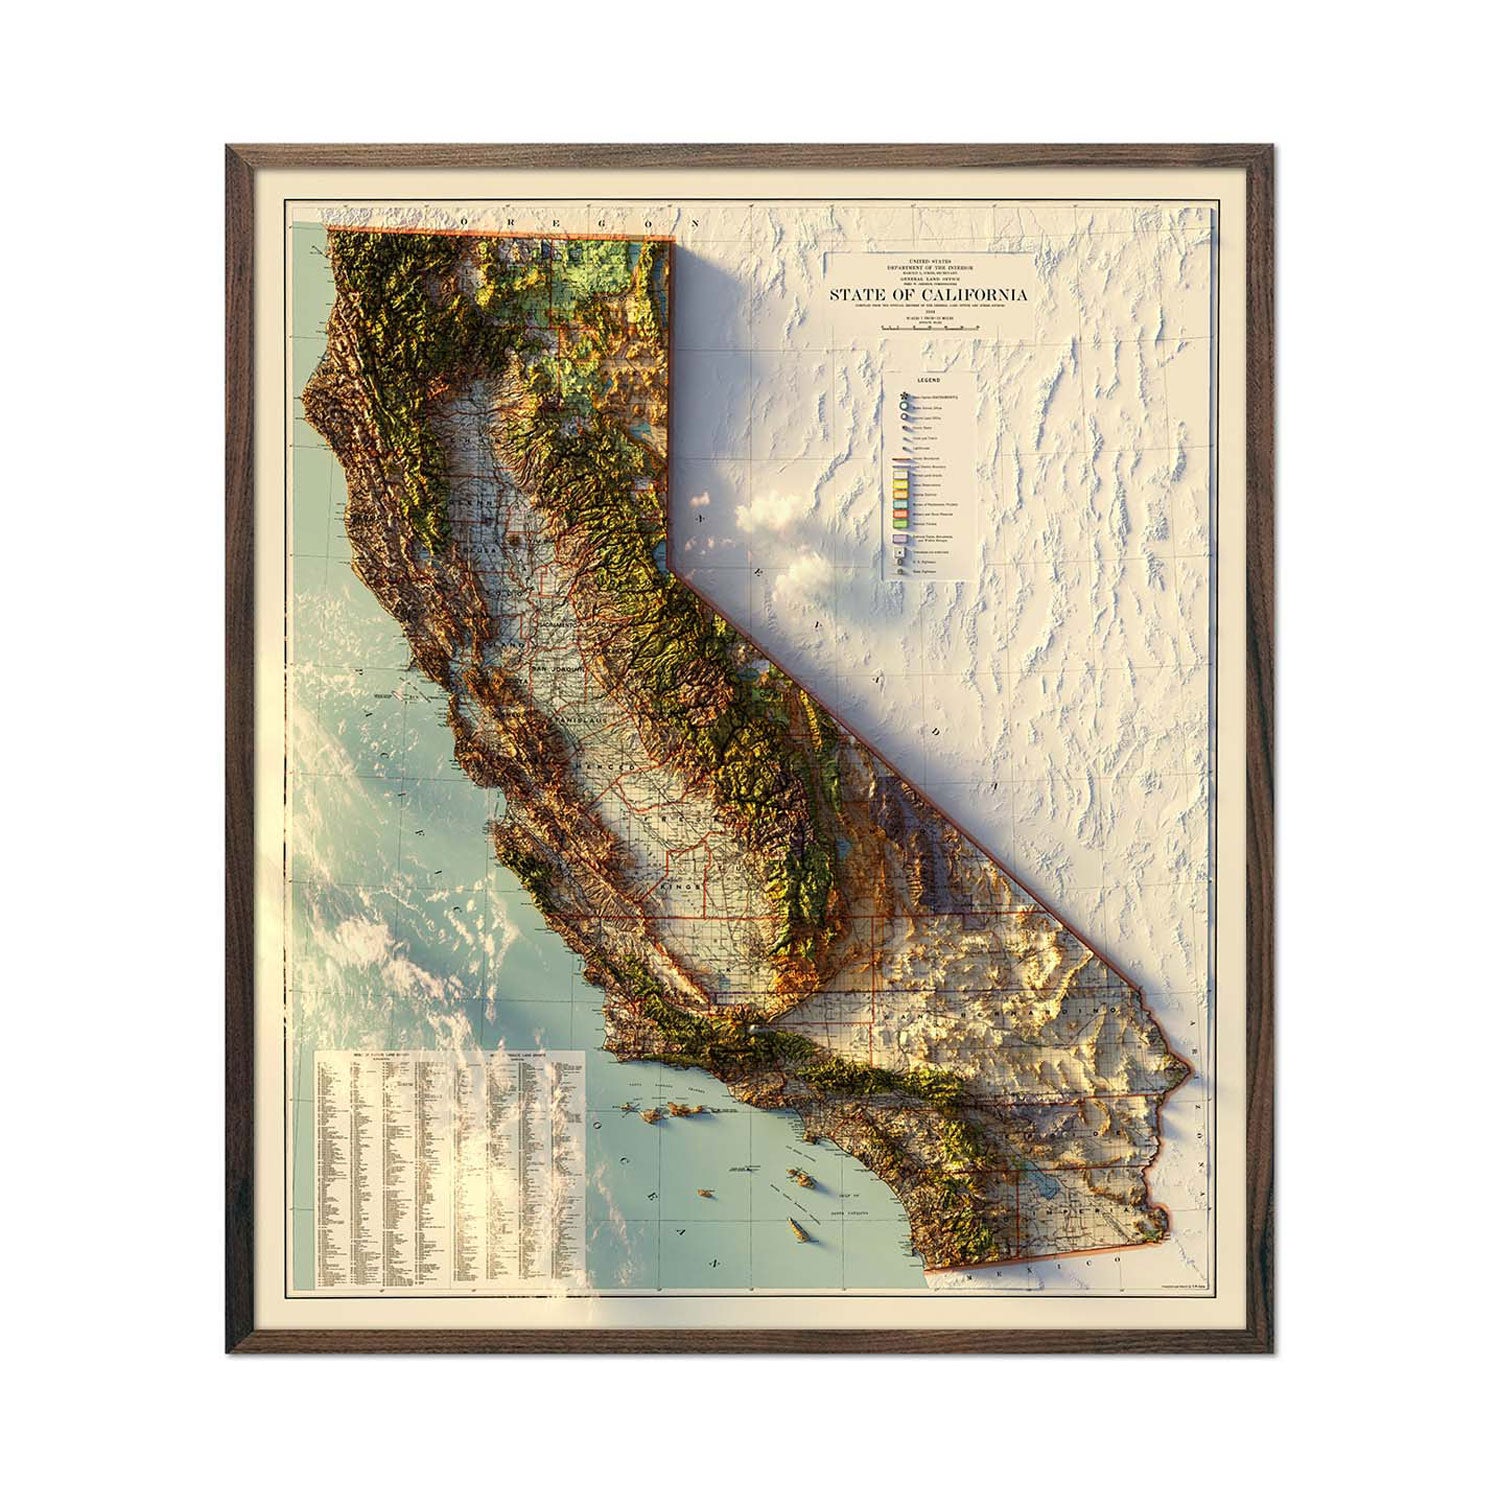
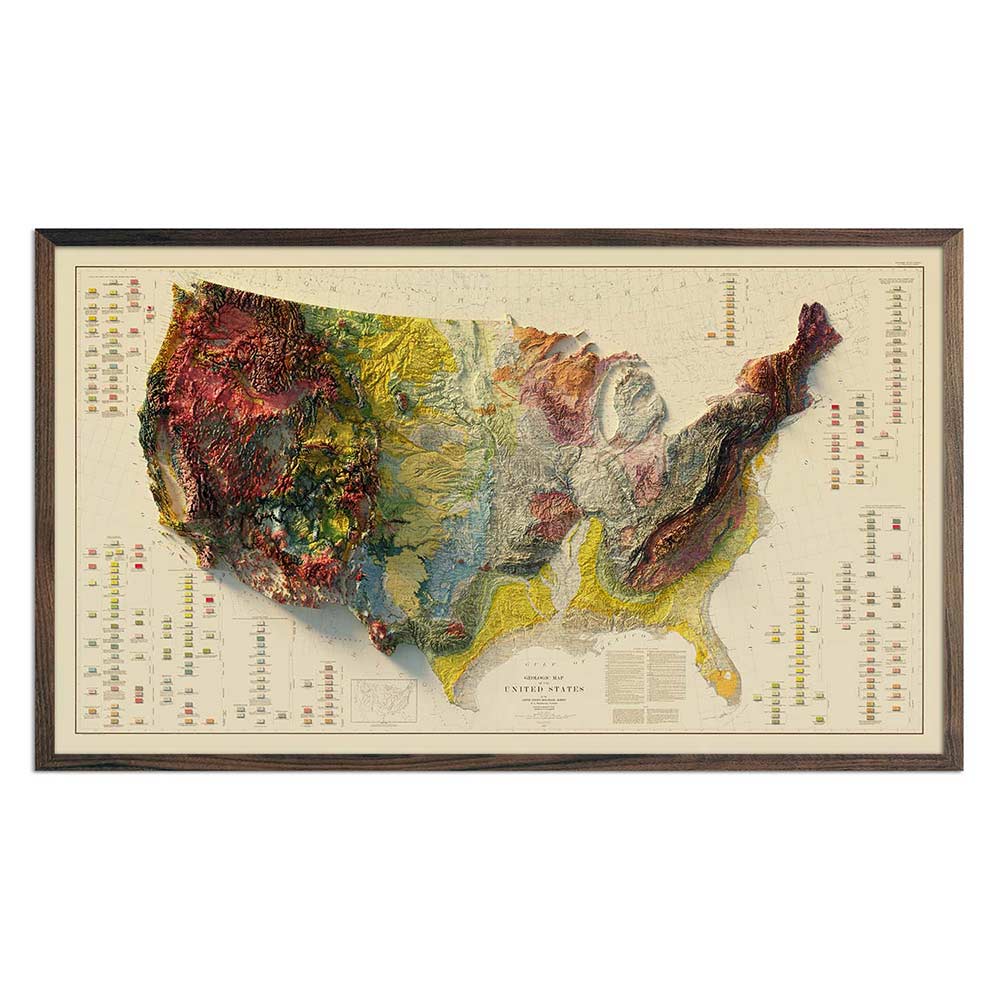
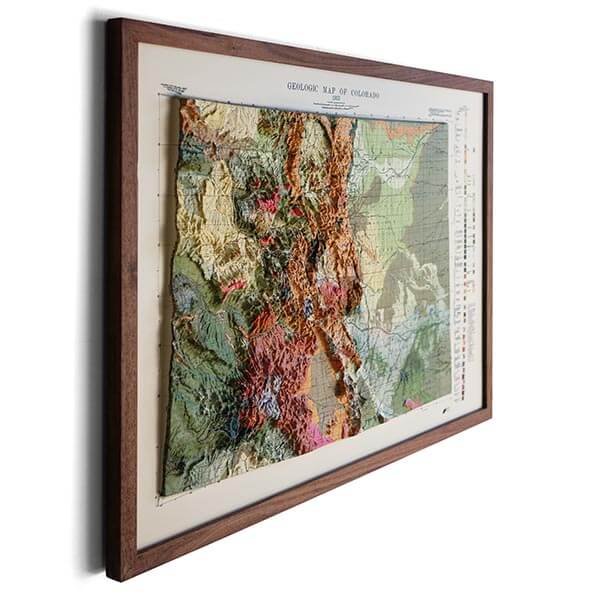
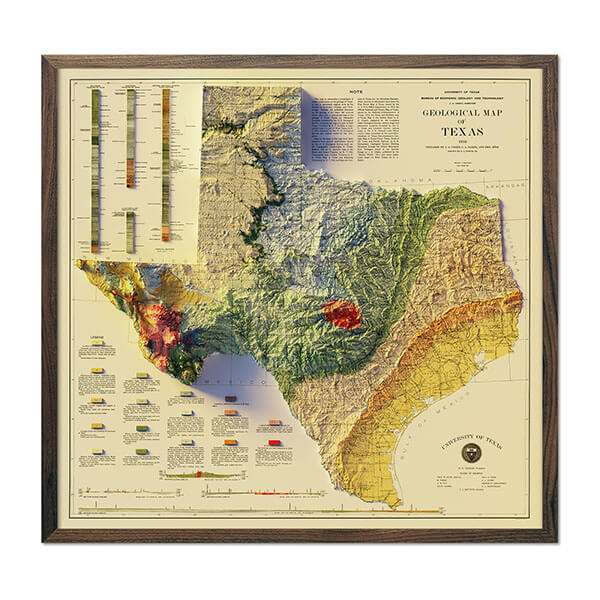
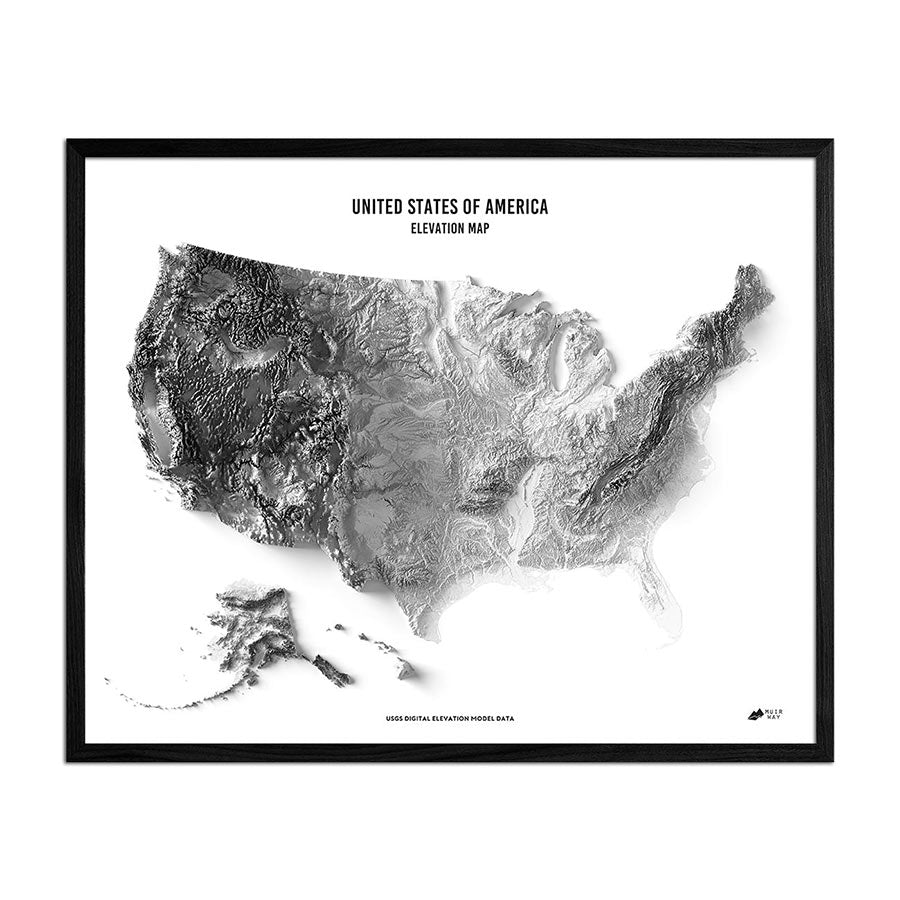
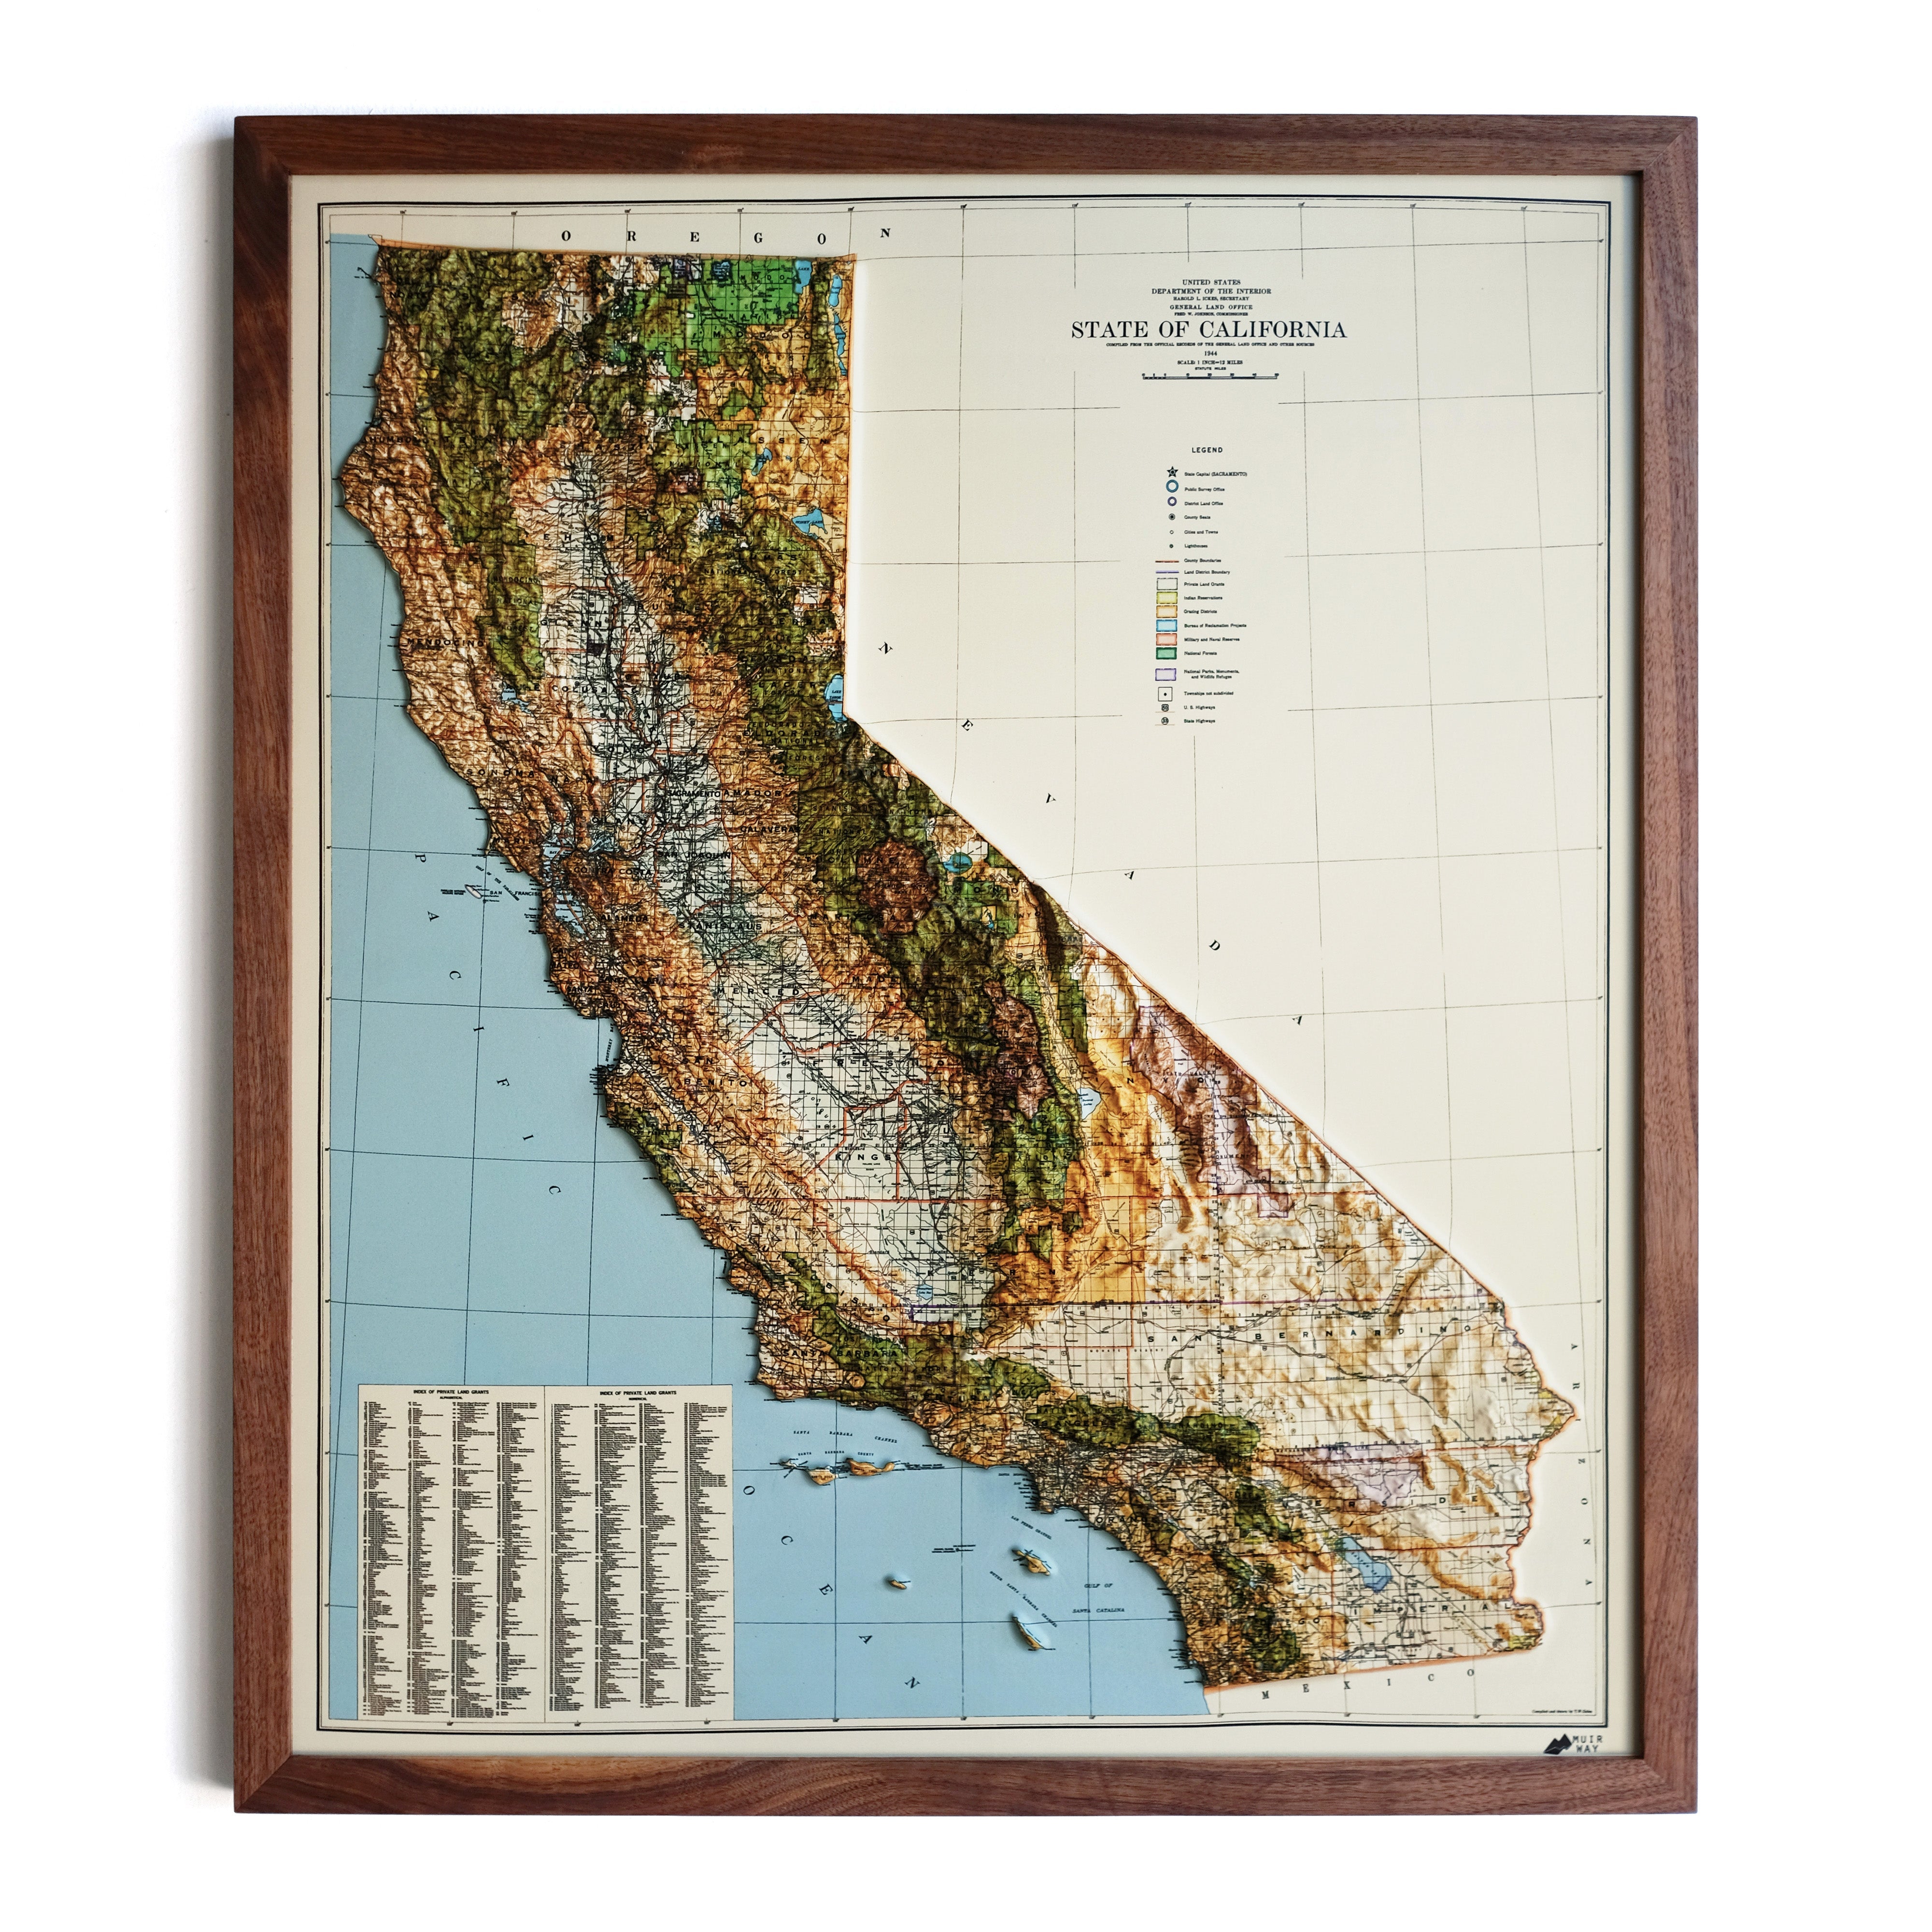
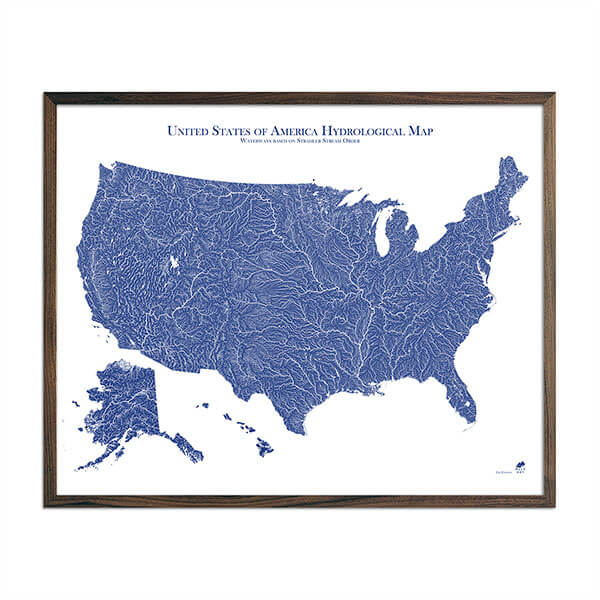
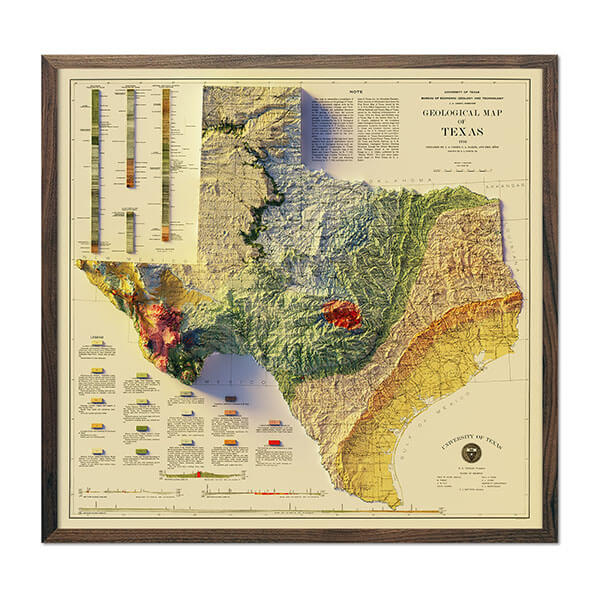
There's an unrivaled beauty in the intricacy and precision of geological maps. At Muir Way, we have recreated the original geological map of the USA into a shaded relief map with the illusion of 3D. This shaded relief map is a masterpiece that invites you on a journey through America's geology, right from the comfort of your home or office.
Crafted from the merging of four distinct vintage maps, this work of art beautifully marries the past and present. It combines the charm of historical cartography with the precision of modern-day data, bringing a depth of detail that showcases the United States' geological diversity in stunning clarity.
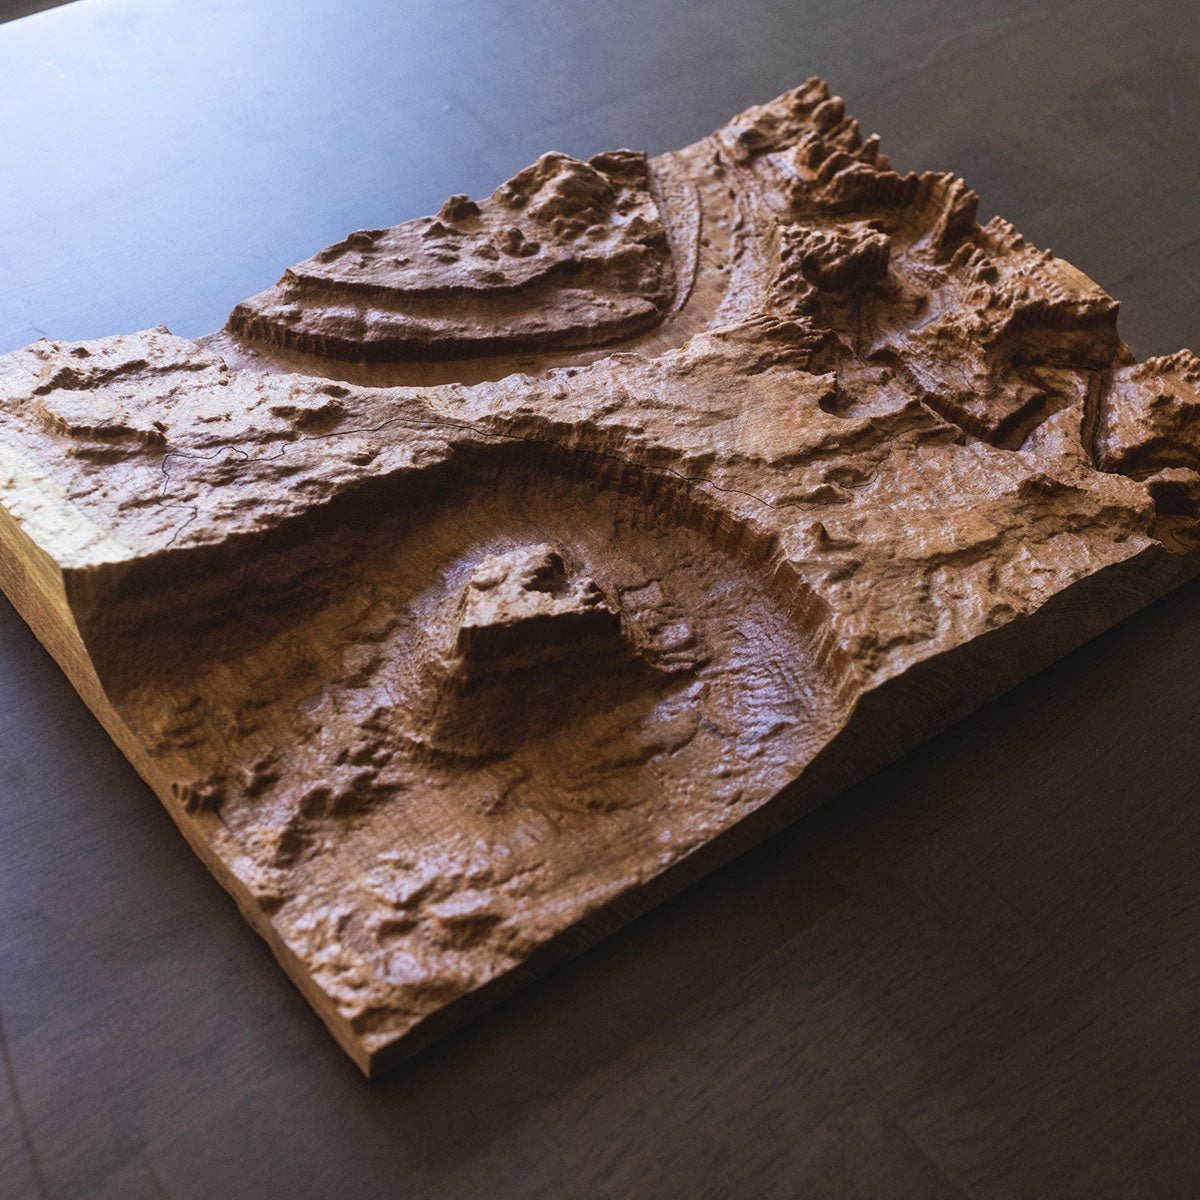
Every ridge and valley, every peak and plain has been brought to life on the page, not through physical embossing, but through expertly applied shades and tones. This illusion of depth provides a 3D experience on a 2D surface, making it a fascinating centerpiece for your wall.
Final Thoughts on How to Read Geological Maps
Understanding how to read geological maps opens a new window into our world, revealing the hidden narratives of Earth's past etched into its terrain. These maps are more than just tools for geologists - they are pieces of art, history, and education all rolled into one.
Whether you're a seasoned geologist, a student of the earth, or simply a lover of beautifully crafted cartography, our geological map reproduction is a perfect addition to your home or office. Each one is a celebration of Earth's history, a conversation starter, and a timeless decor piece.
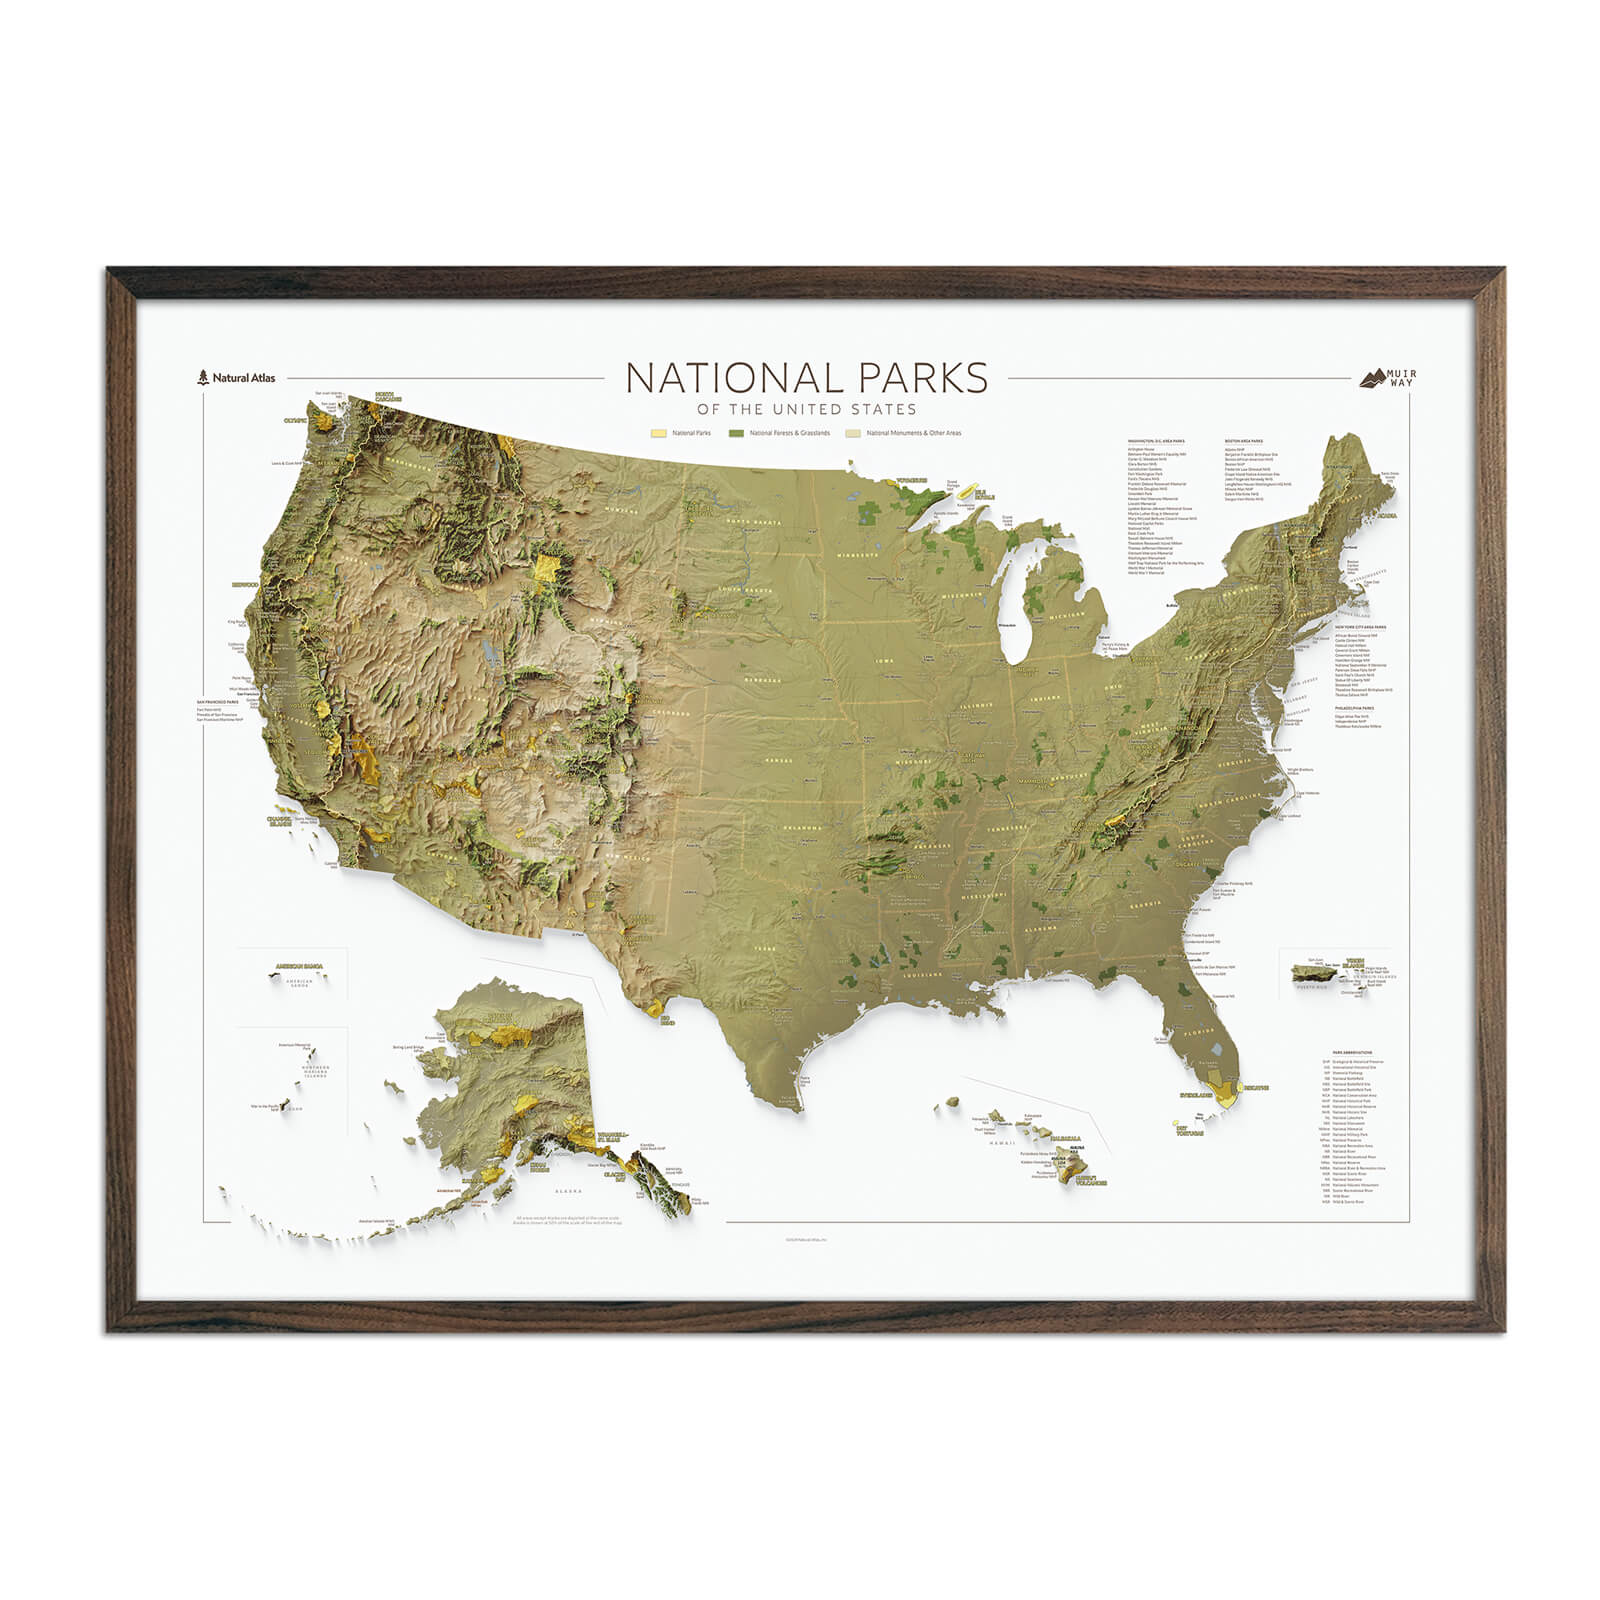
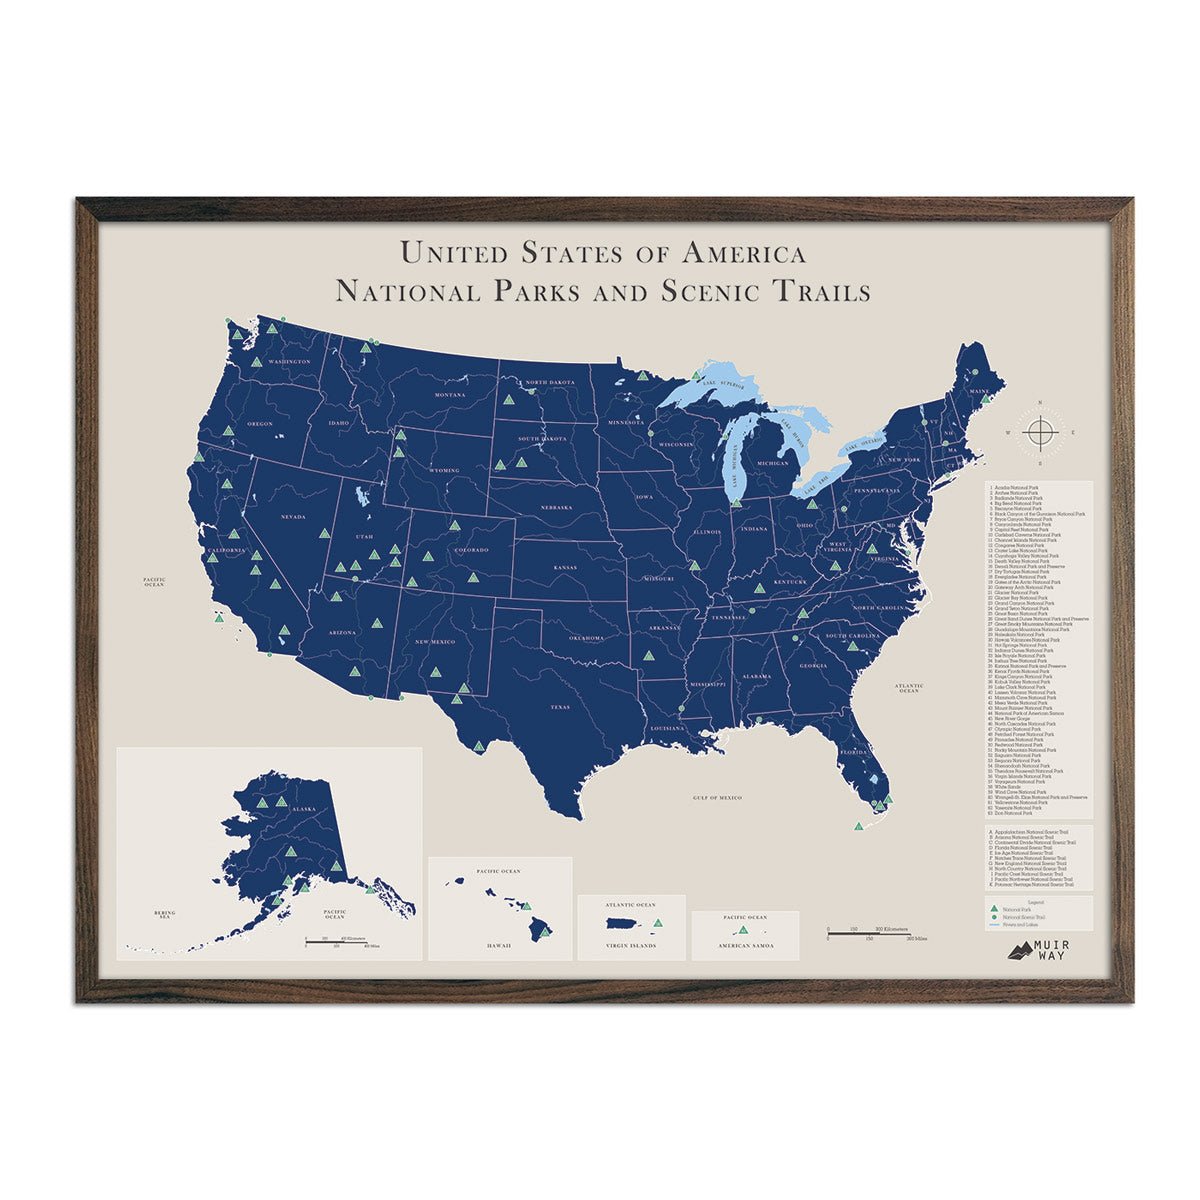
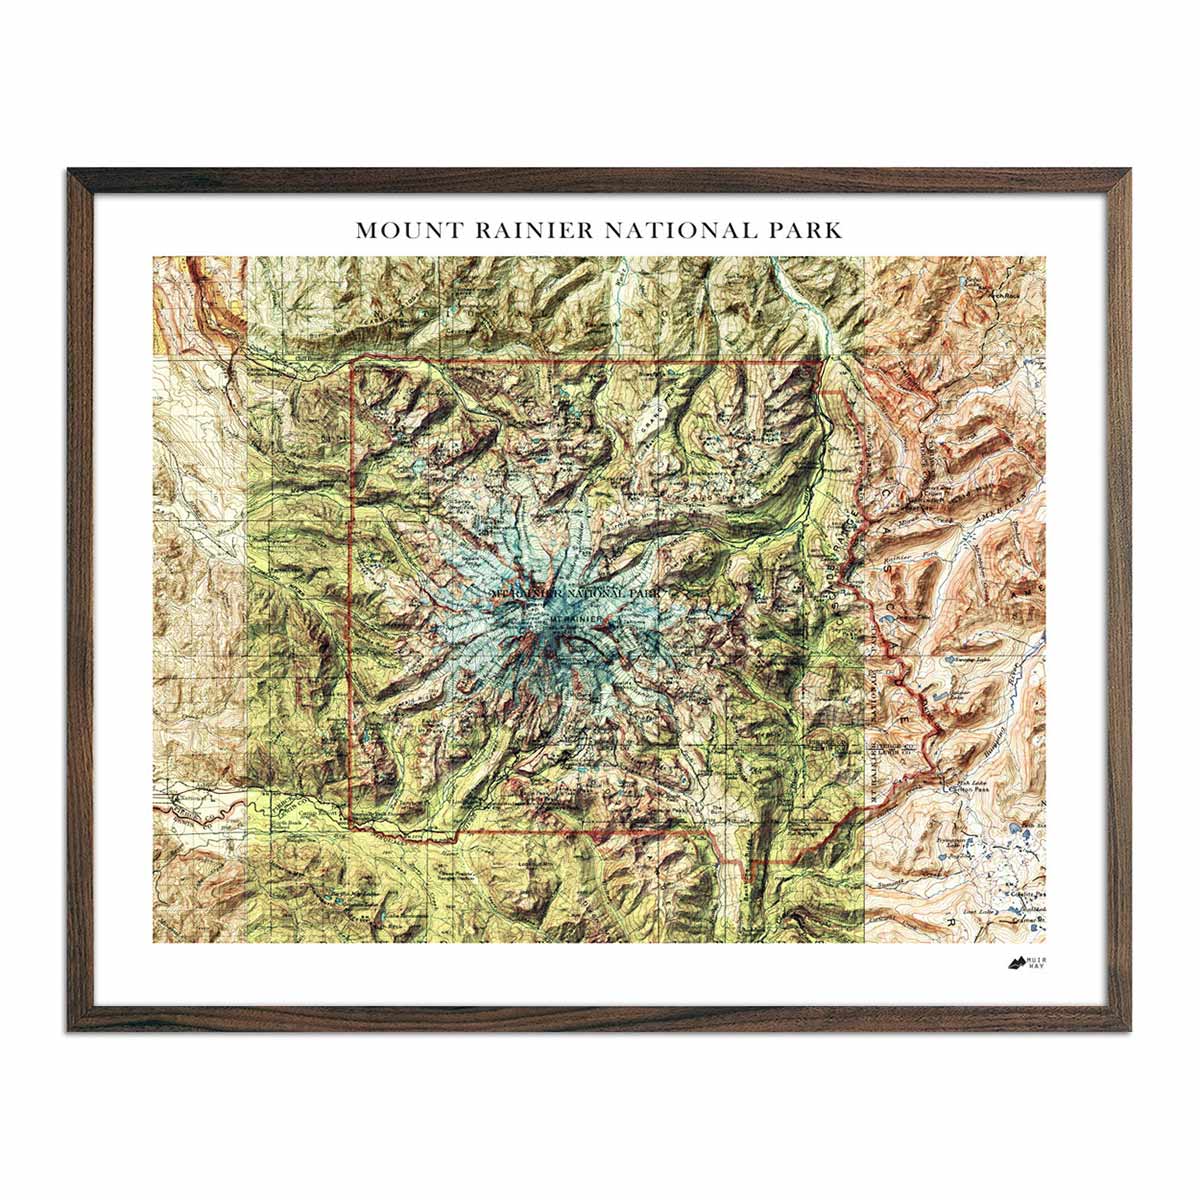
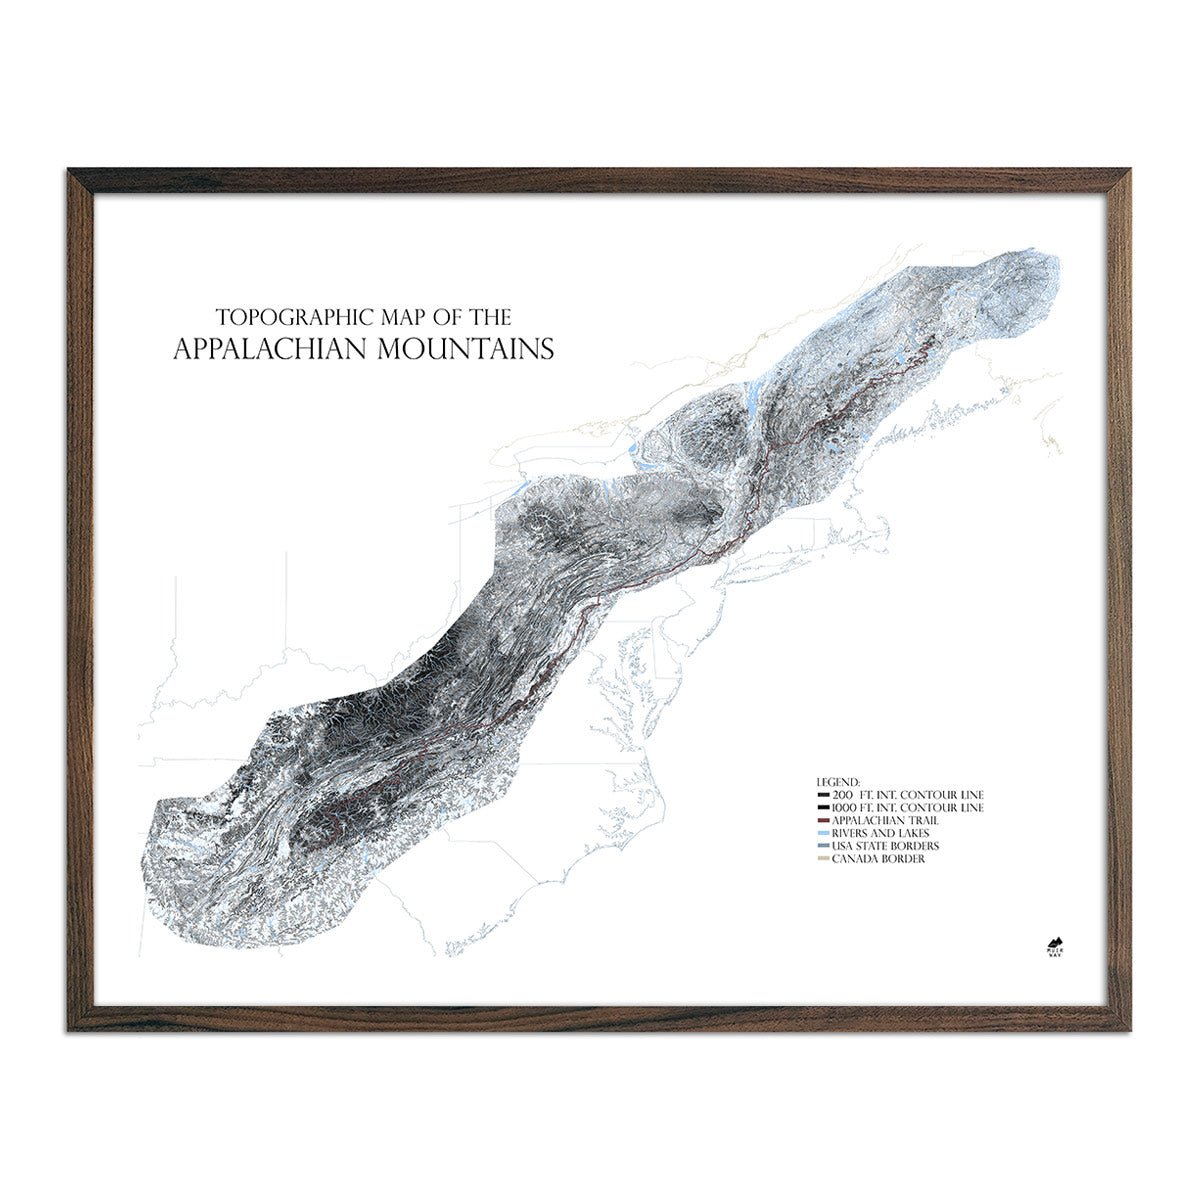
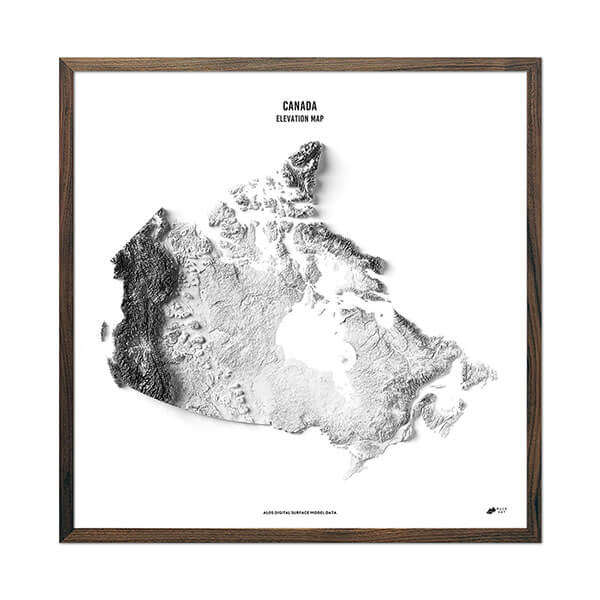
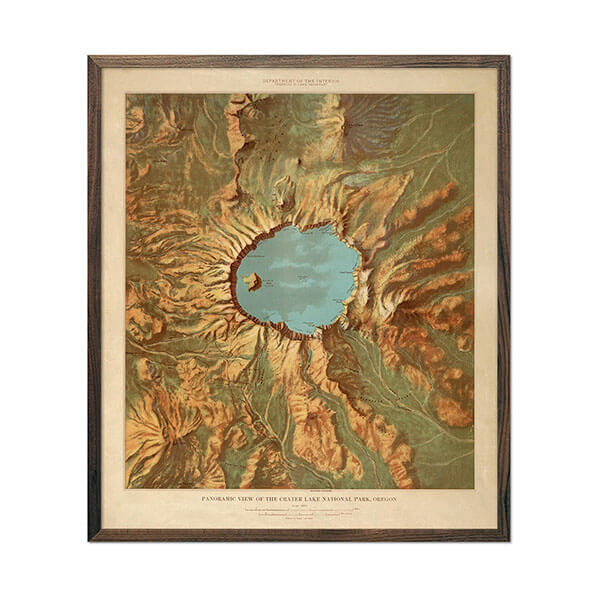
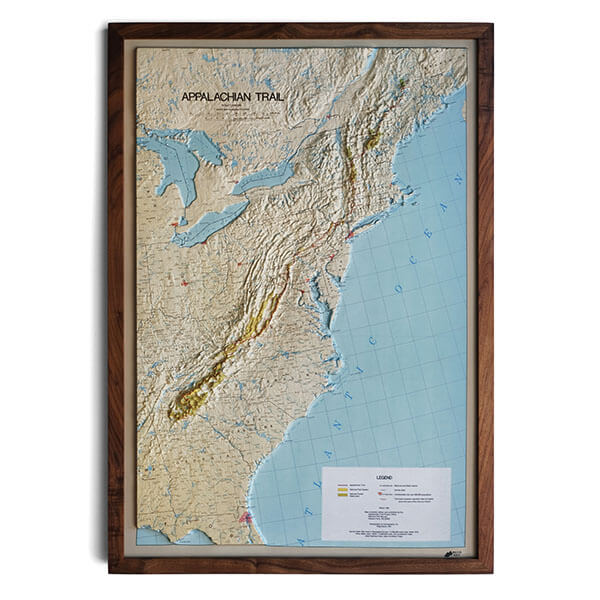
Explore our collection today, which spans beyond geological maps. We have relief maps, maps of US mountain ranges, maps of national parks, 1883 US maps, and our new 3D relief maps. See all that we have in store for you at Muir Way and elevate your home decor in a unique, inspiring way!