


The world we live in is seldom flat, but is usually characterized by mountain peaks, rolling hills, deep canyons, and other physical features that define the earth’s surface. Cartographers have been challenged with the task of how to best represent earth’s complex landscapes in two-dimensional maps. This graphic need has led to the development of amazing relief maps, bridging the gap between two-dimensional maps and the varied, three-dimensional terrain they represent.
What is a relief map?
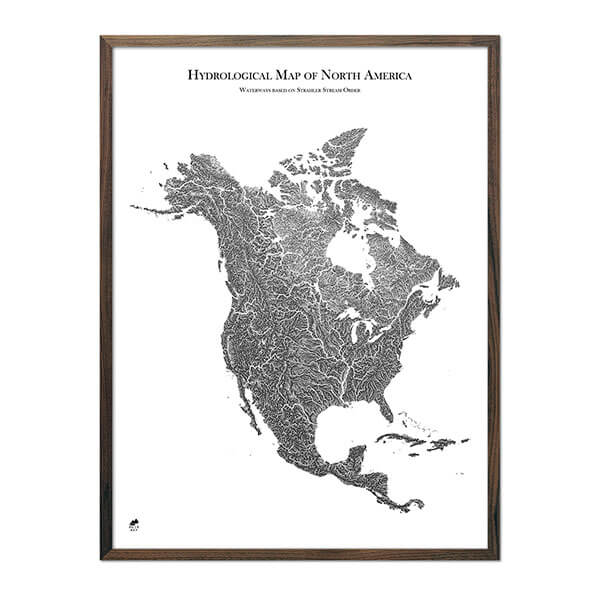
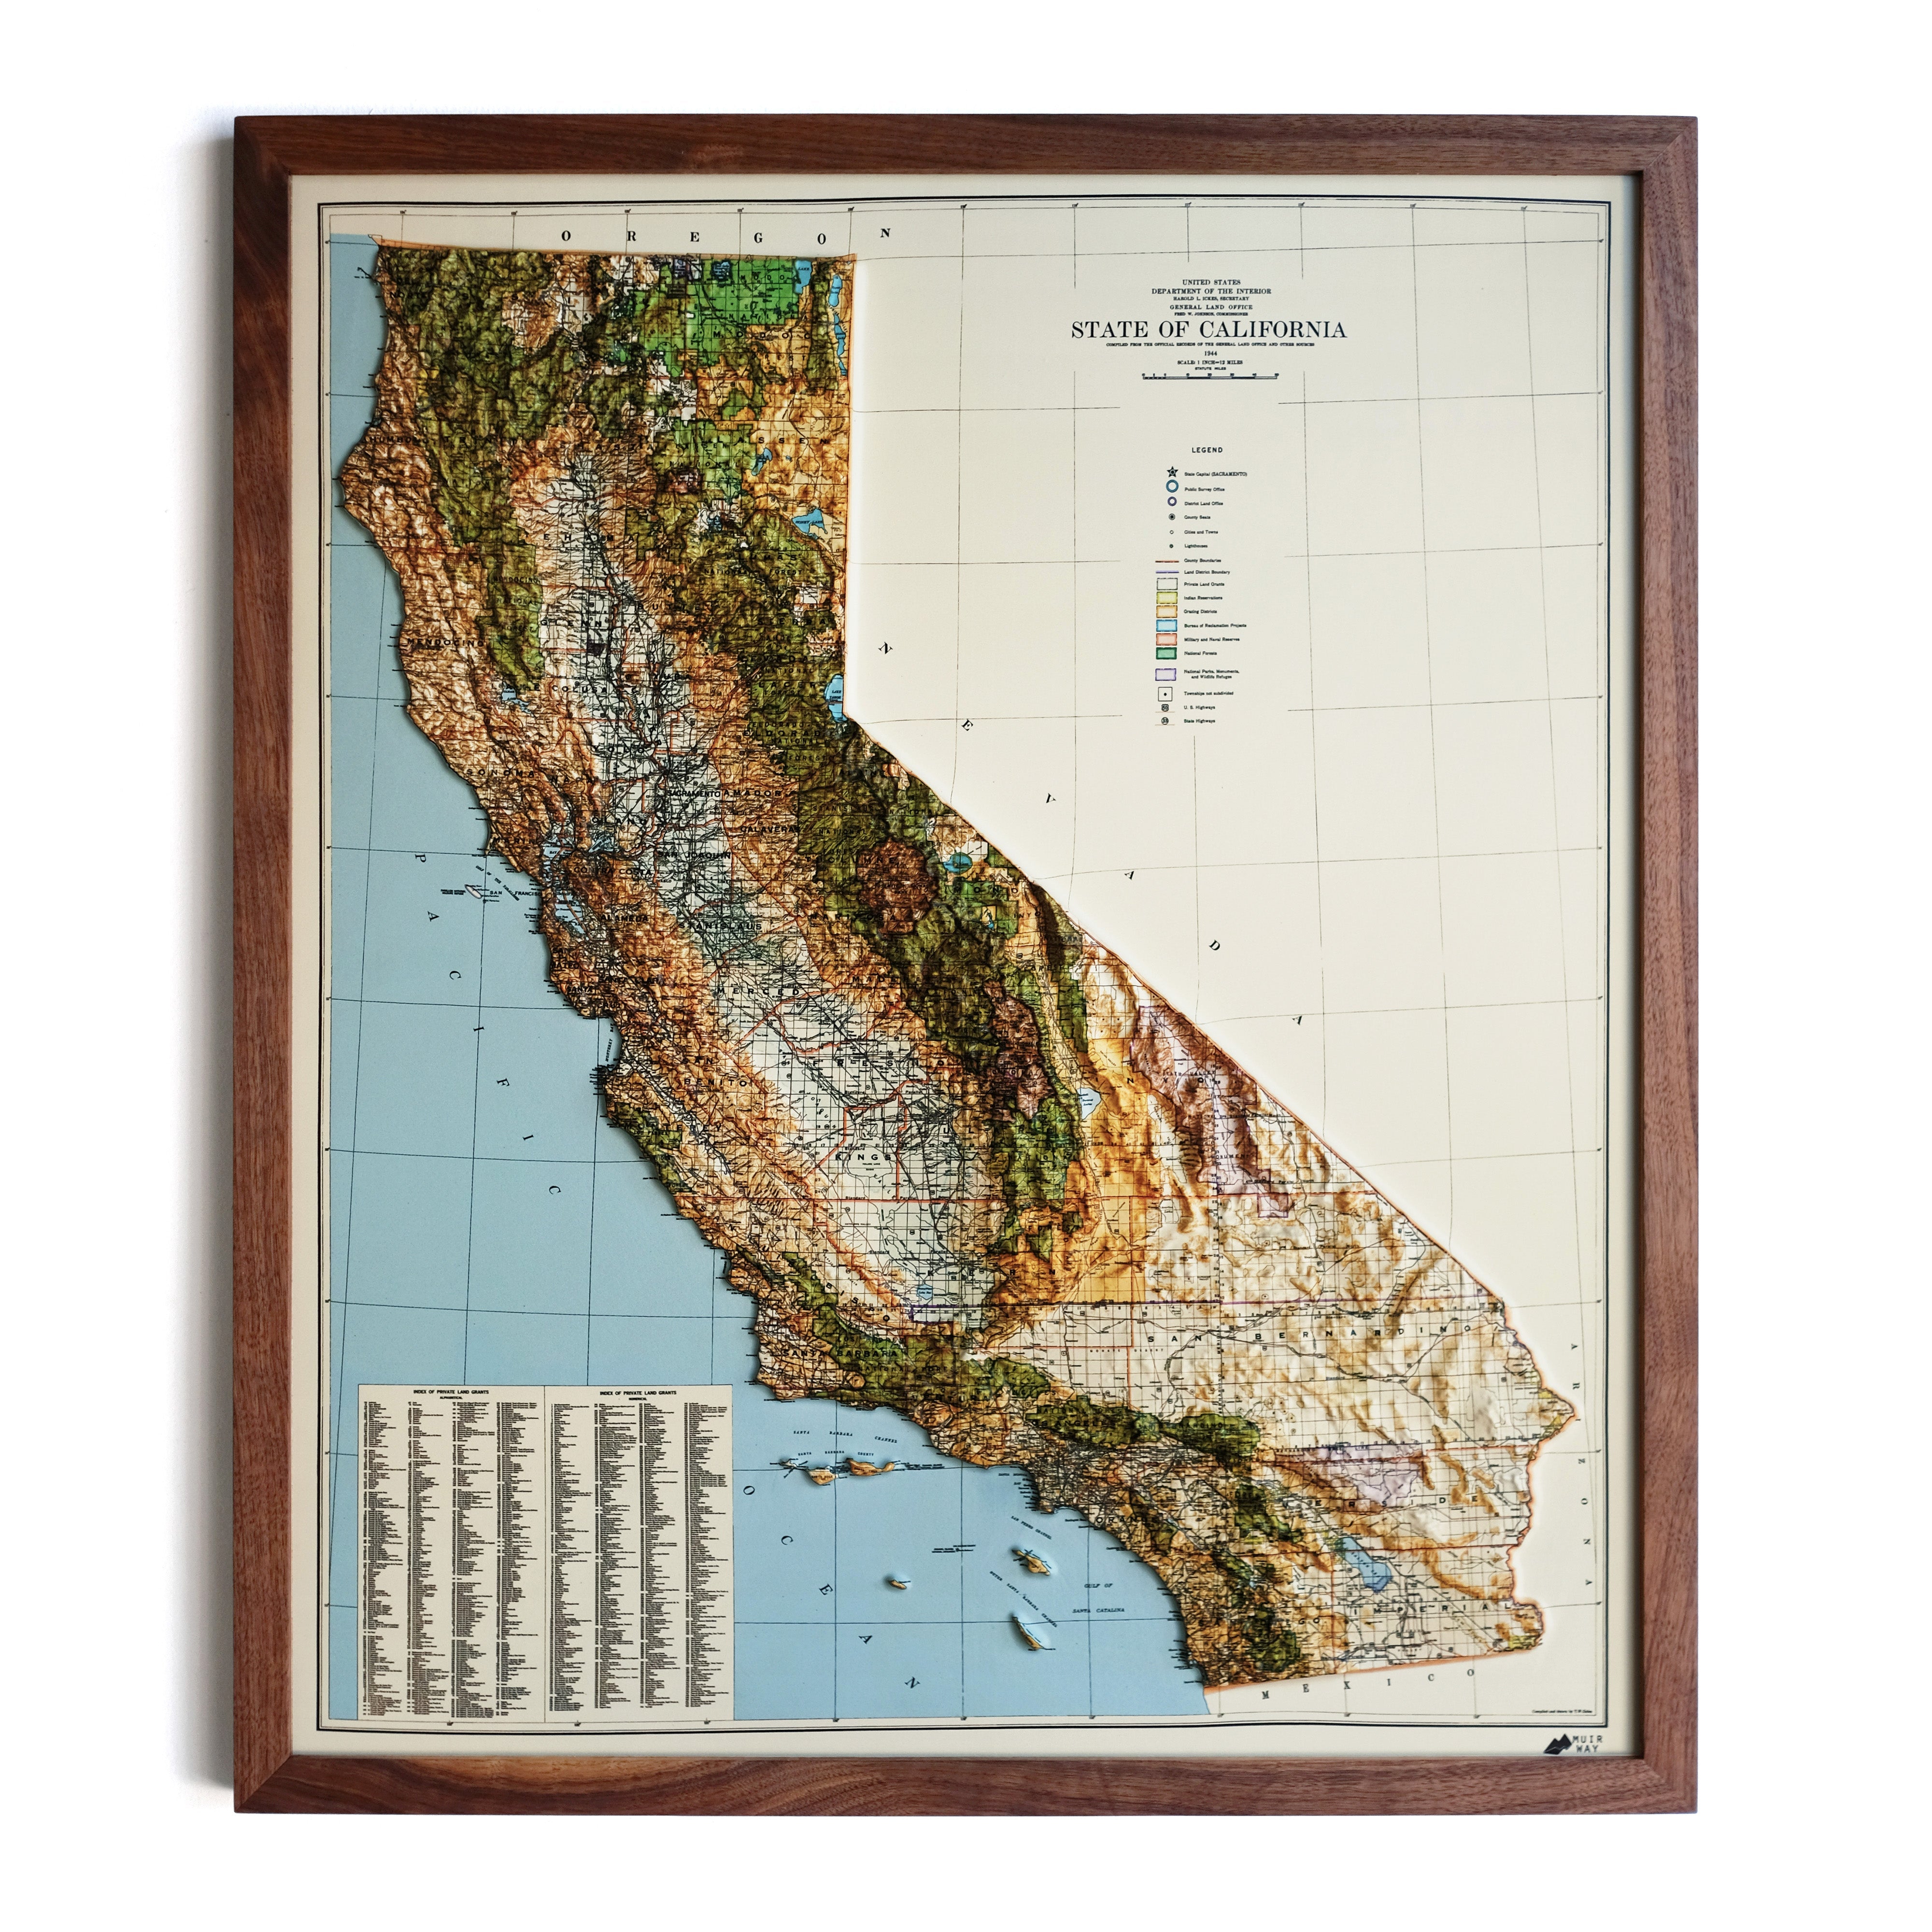
Relief maps are artistically detailed maps that represent the variation in a given area's slope, aspect, and elevation, illustrating the underlying geography of the landscape.
Are relief maps and topographical maps the same?
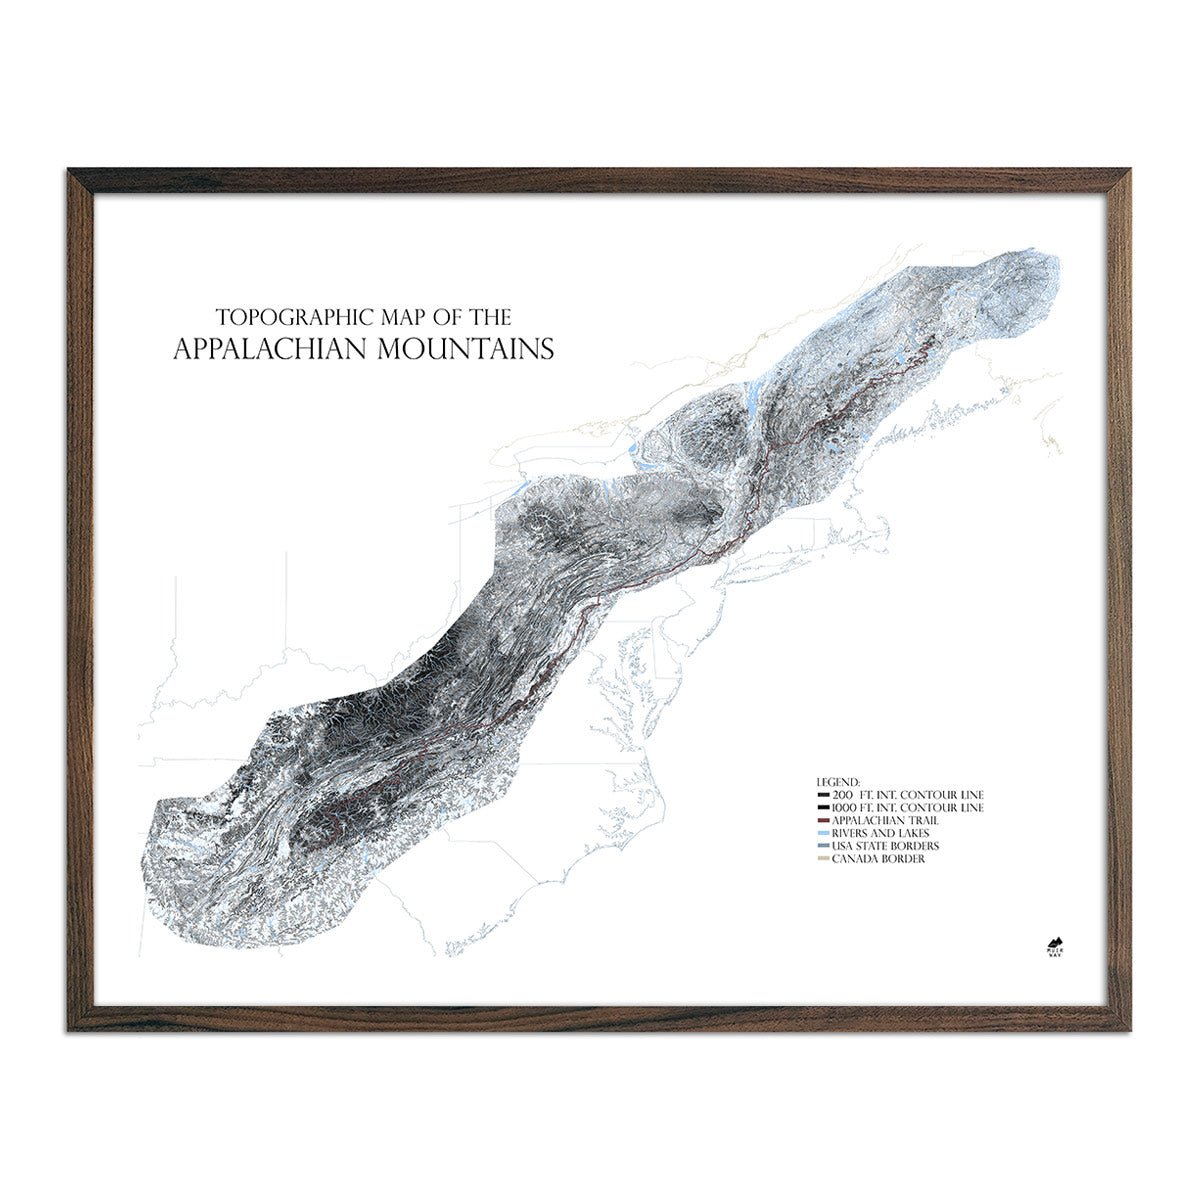
Relief maps are usually more visually expressive than traditional topographical maps, since they are able to depict landforms more realistically in comparison to topographical maps, which typically rely on contour lines and spot heights to depict elevation. Using only contour lines to represent the earth’s surface can be hard to interpret, especially to those unfamiliar with cartography. Complex terrain can make interpretation harder still. Relief maps are easy to understand and interpret visually, proving very useful for accurately communicating a true representation of the landscape. Relief maps also require less technical knowledge to be understood.
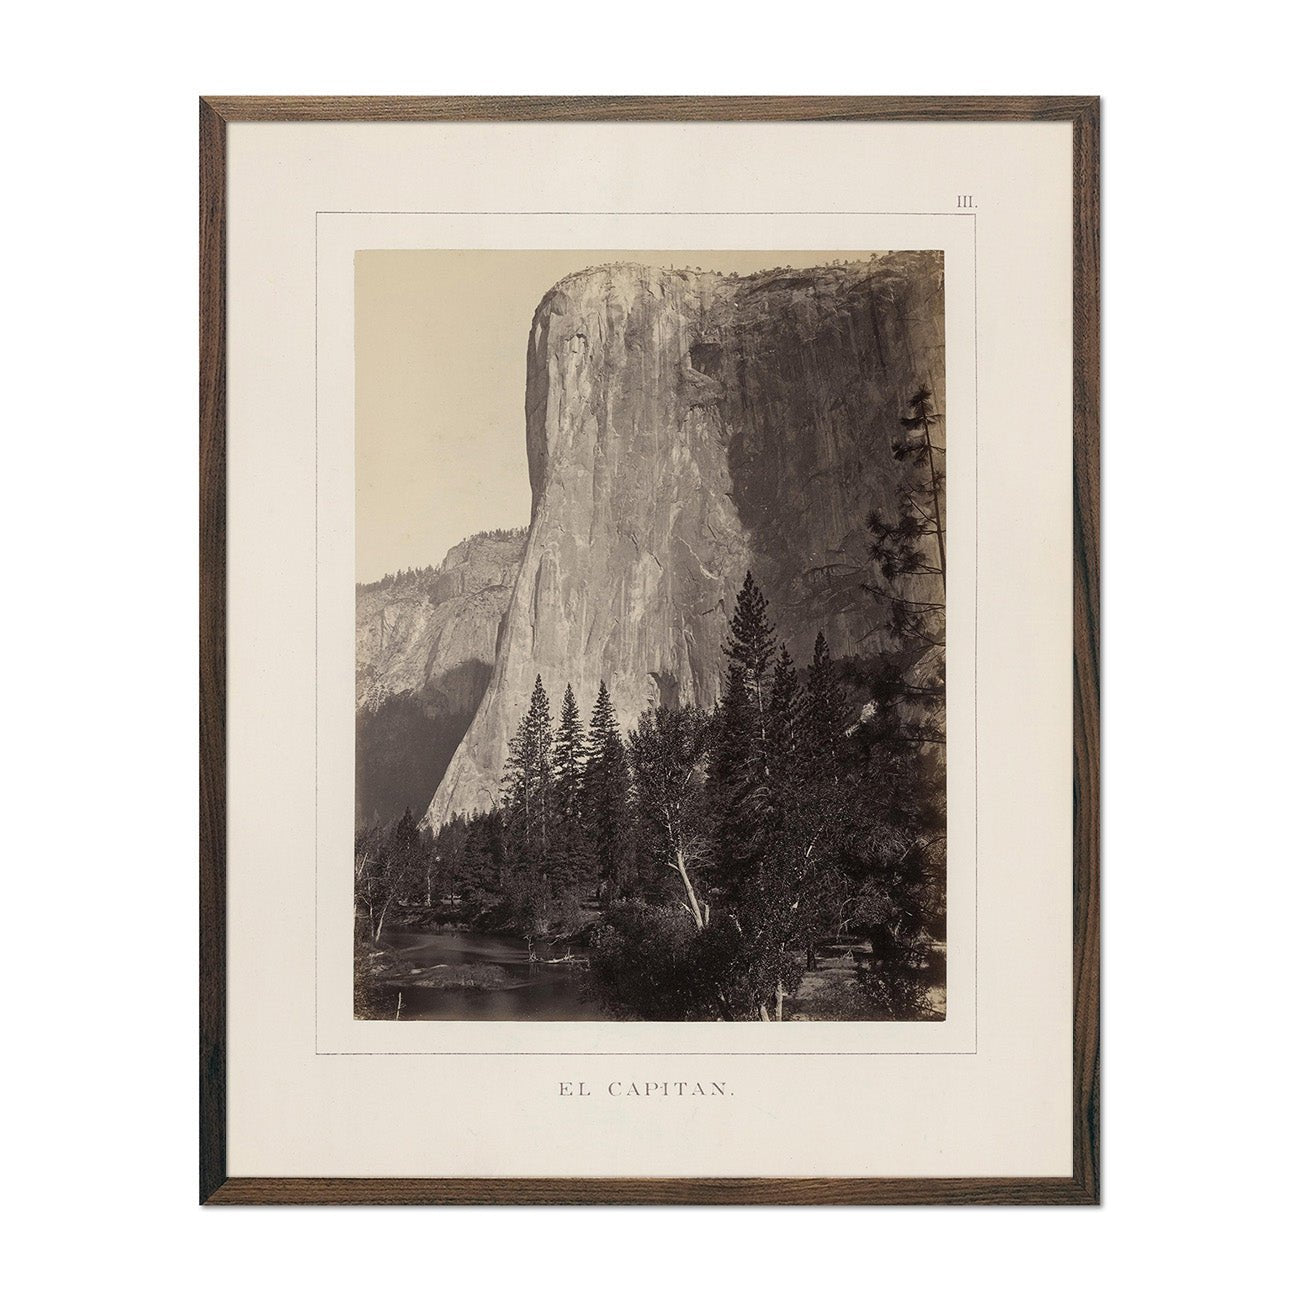
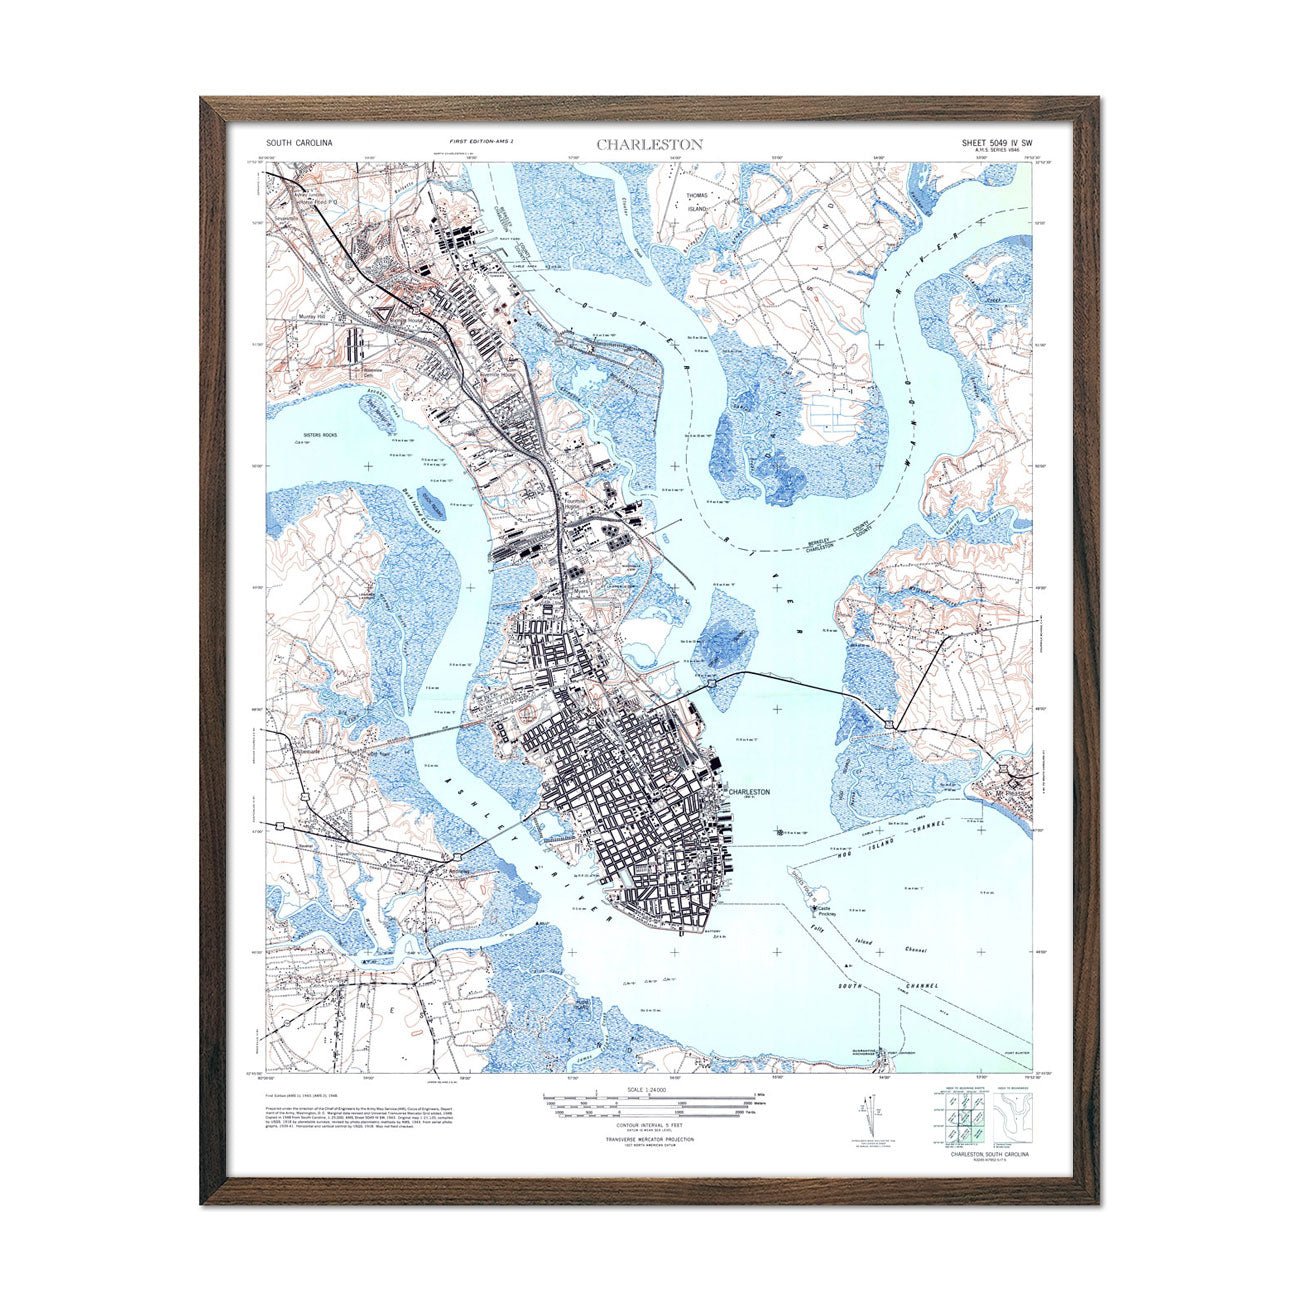
Topographic Map of Yosemite Valley:

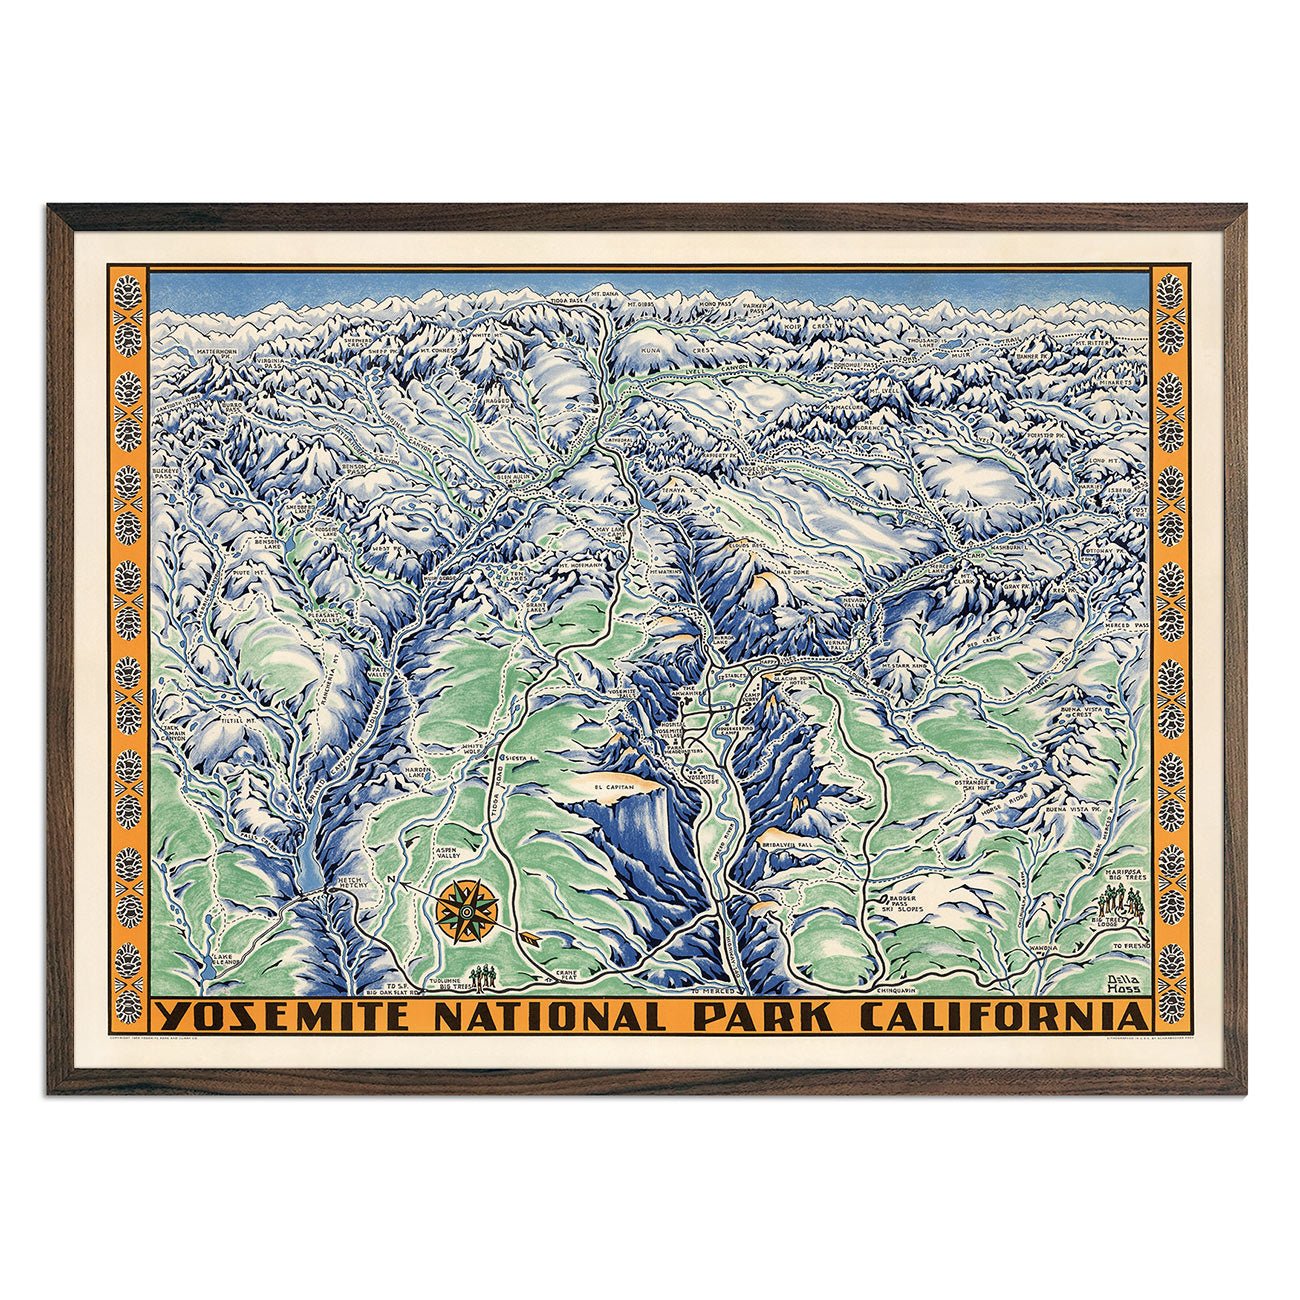
Relief Map of Yosemite Valley:

Relief representation techniques - How are relief maps made?
Over time, cartographers have developed different techniques for creating effective cartographic illustration of landform elevation, shape, and depth.
Physiographic illustration using shaded relief
An early relief mapping technique used to represent landforms on maps was called physiographic illustration. Developed by A.K. Lobeck in 1921, this relief mapping technique imitated landform shapes over large areas by combining hill profiles with shaded relief. This method proved successful in exemplifying geographical characteristics of major landforms. Although uncommon in modern mapping applications, ski resorts often still use this mapping method.

Oblique maps
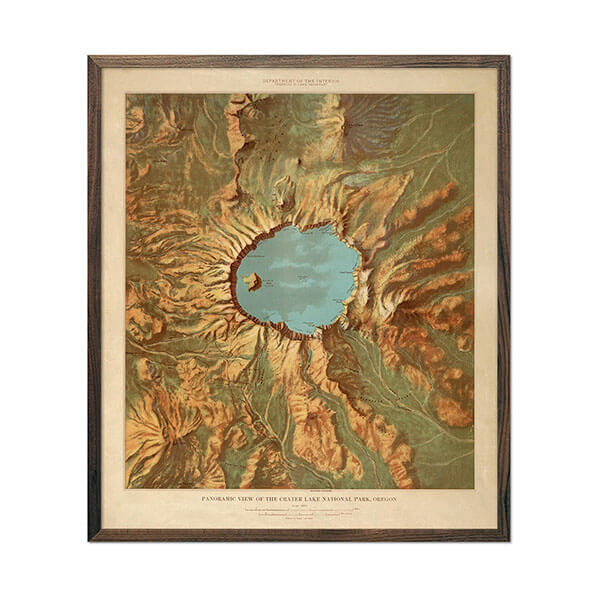
Oblique maps were developed during the middle ages and involved generating a panoramic, aerial view of the mapped surface. This style of mapping presented a more realistic view of the subject from a hypothetical, elevated vantage point. These “bird’s eye views” of mapped cities and landscapes were popularized during the 1800’s and further advanced with the development of technology. This application exists today, mostly in the form of tourism maps.

The hachures technique using shaded relief
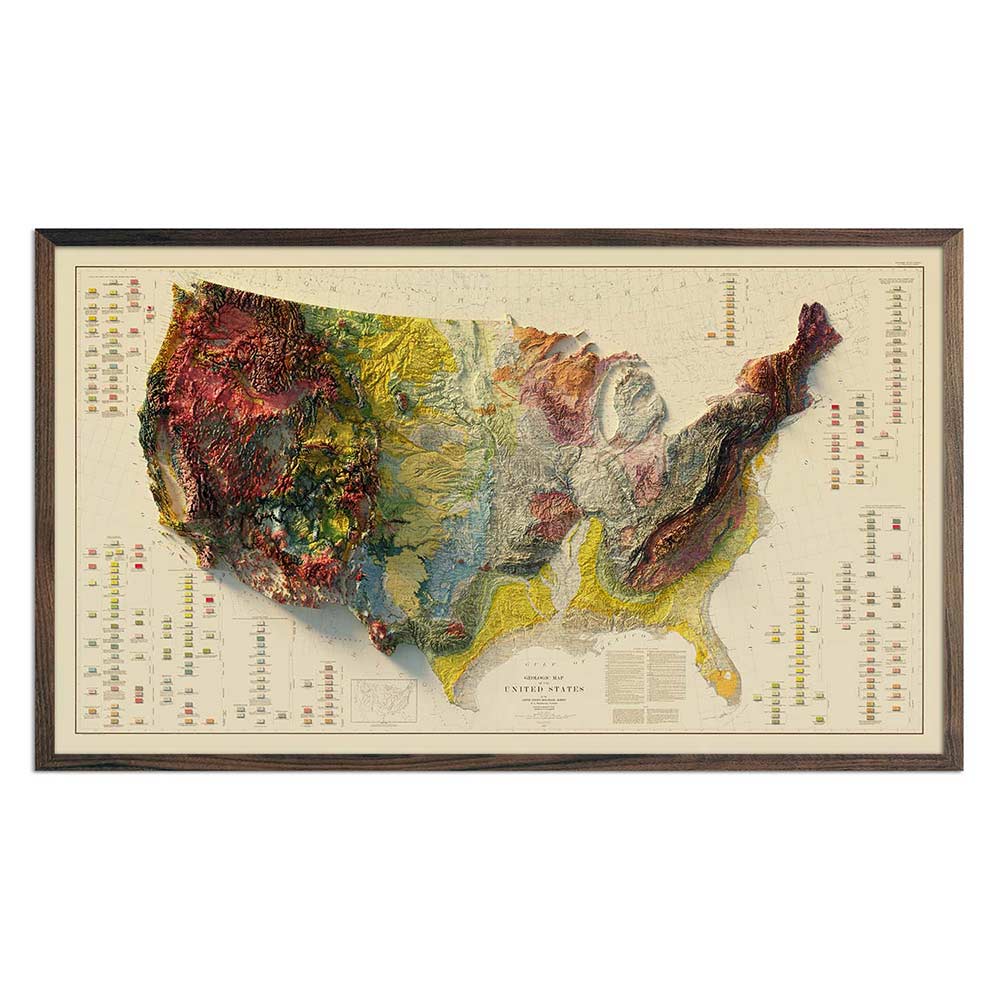
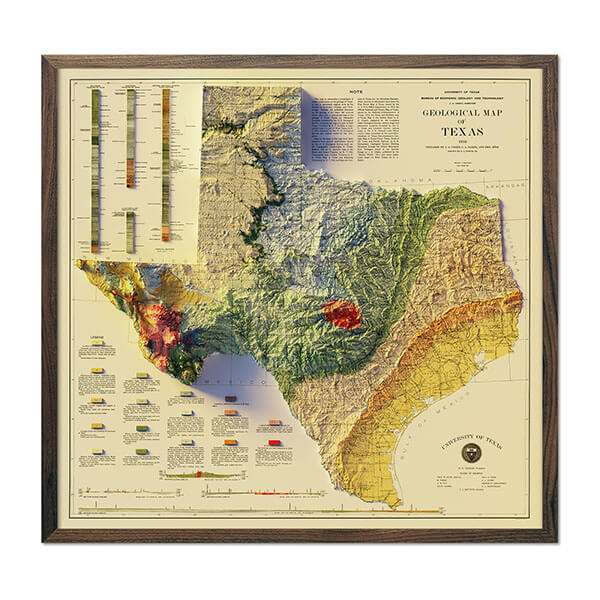
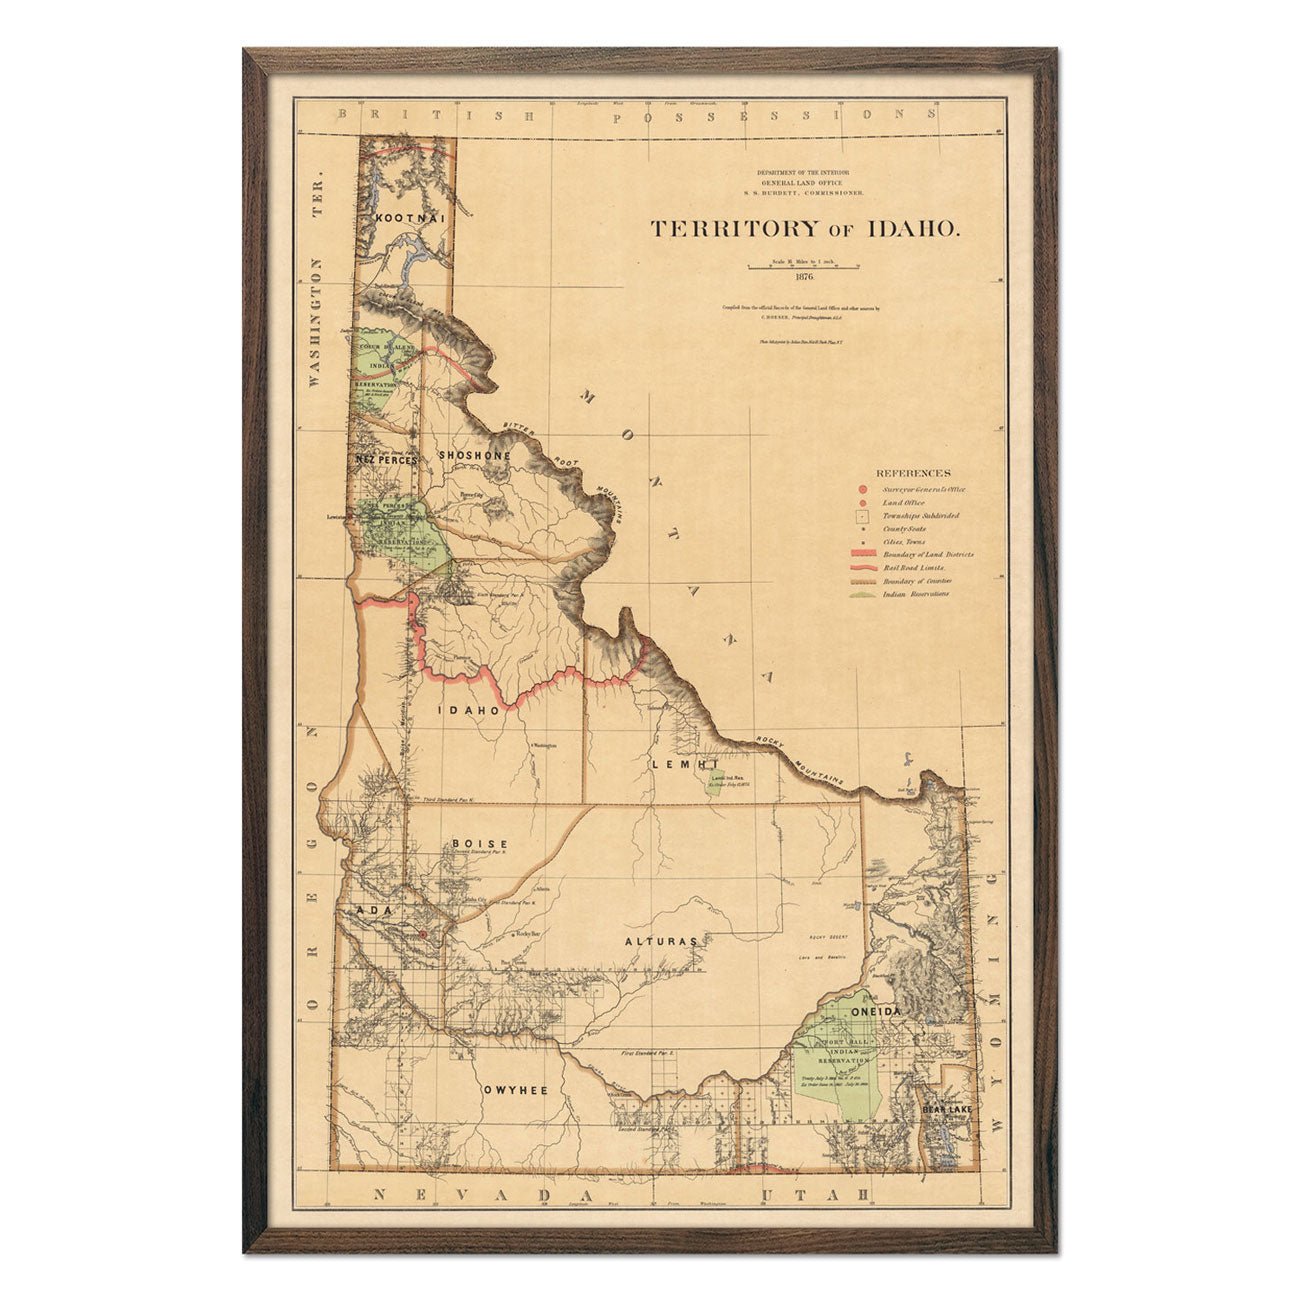
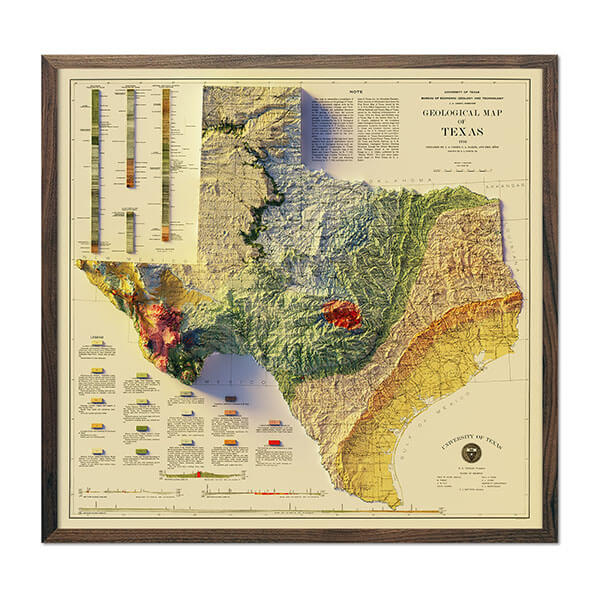
Various uses of shading are used to define relief maps. Hachures was a technique developed by Johann G. Lehmann in 1799 which used lines to shade slope, suggesting increasing steepness with increasing hatching of lines. Hypsometric tints, also known as elevation coloring, used colors assigned to different elevations to indicate high and low points in the terrain. This method is seldom used in mainstream, modern cartography, but may be encountered in more artistic mapping applications.

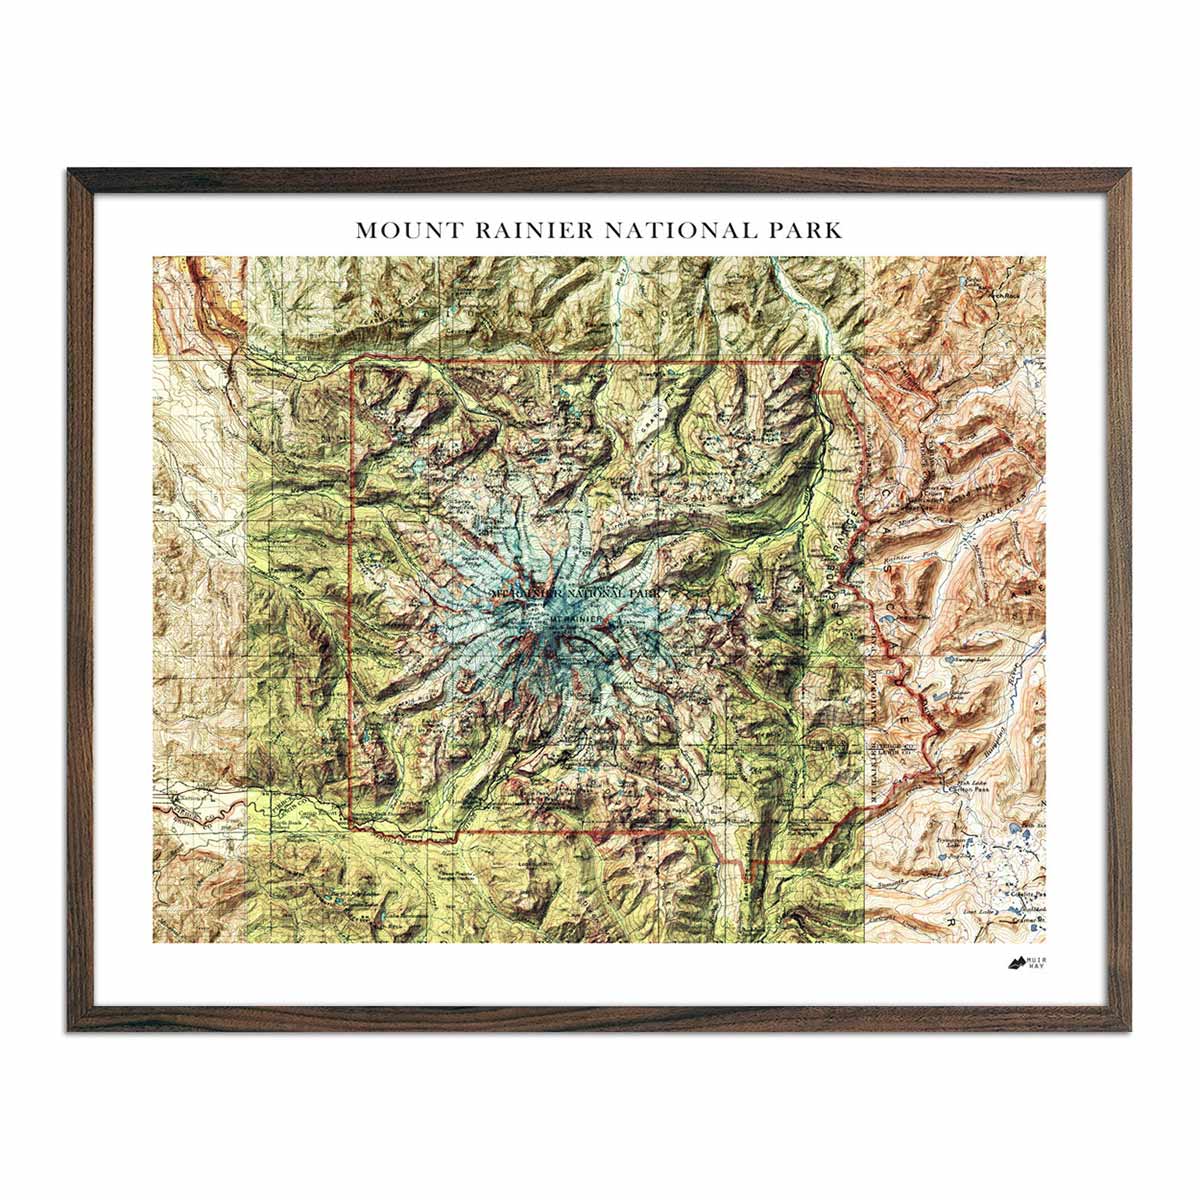
Shaded relief maps - Hill-shading
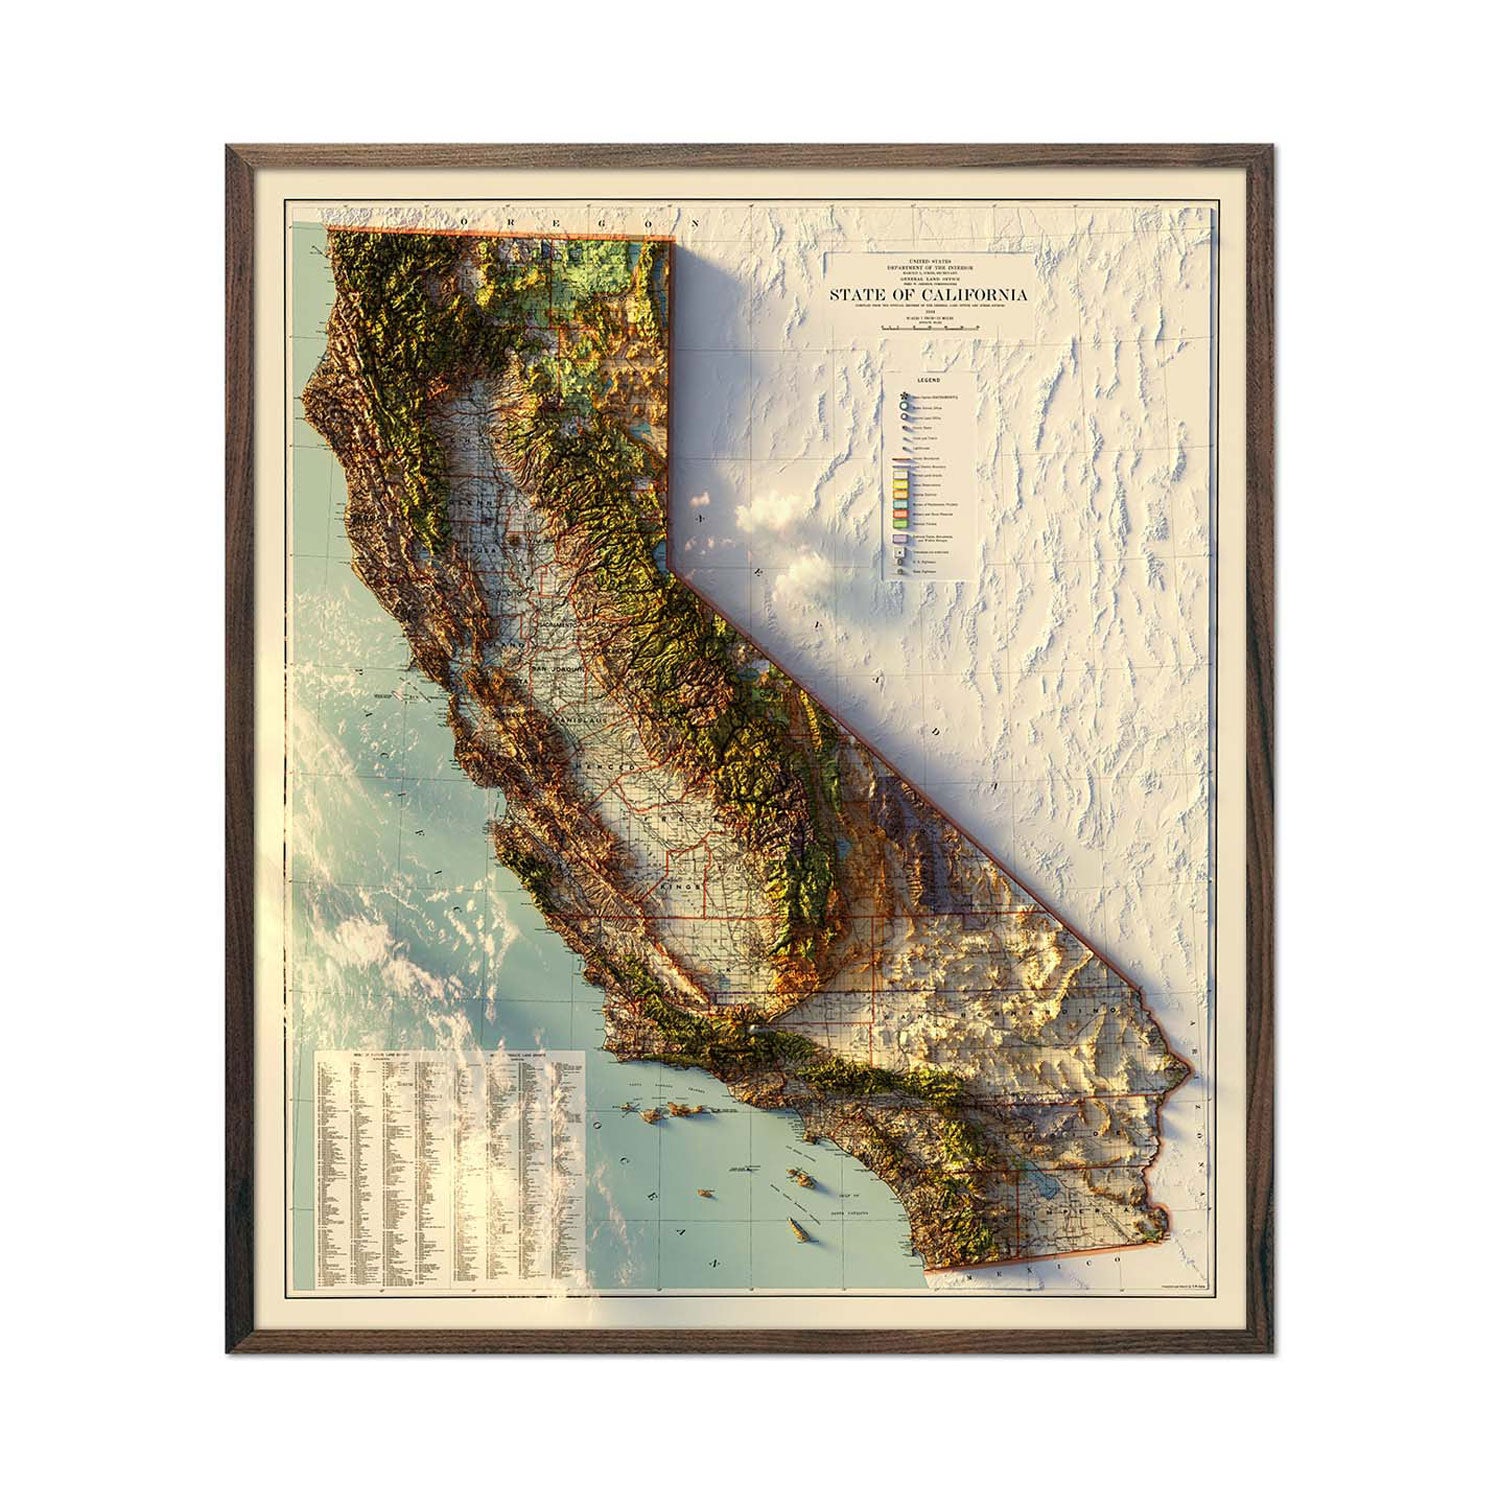
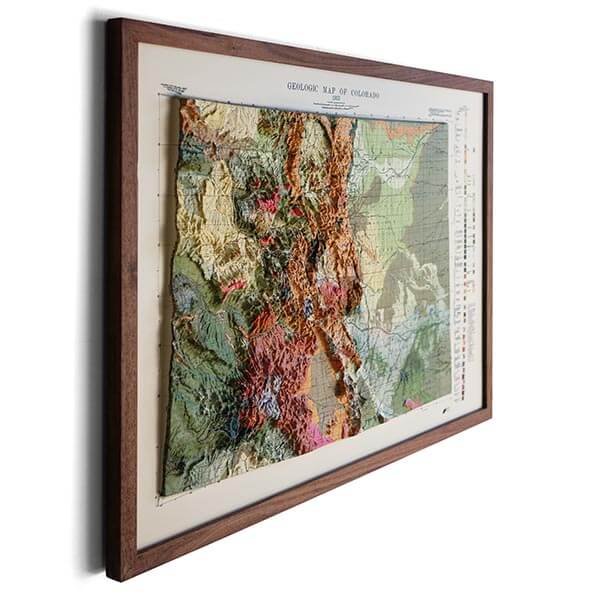
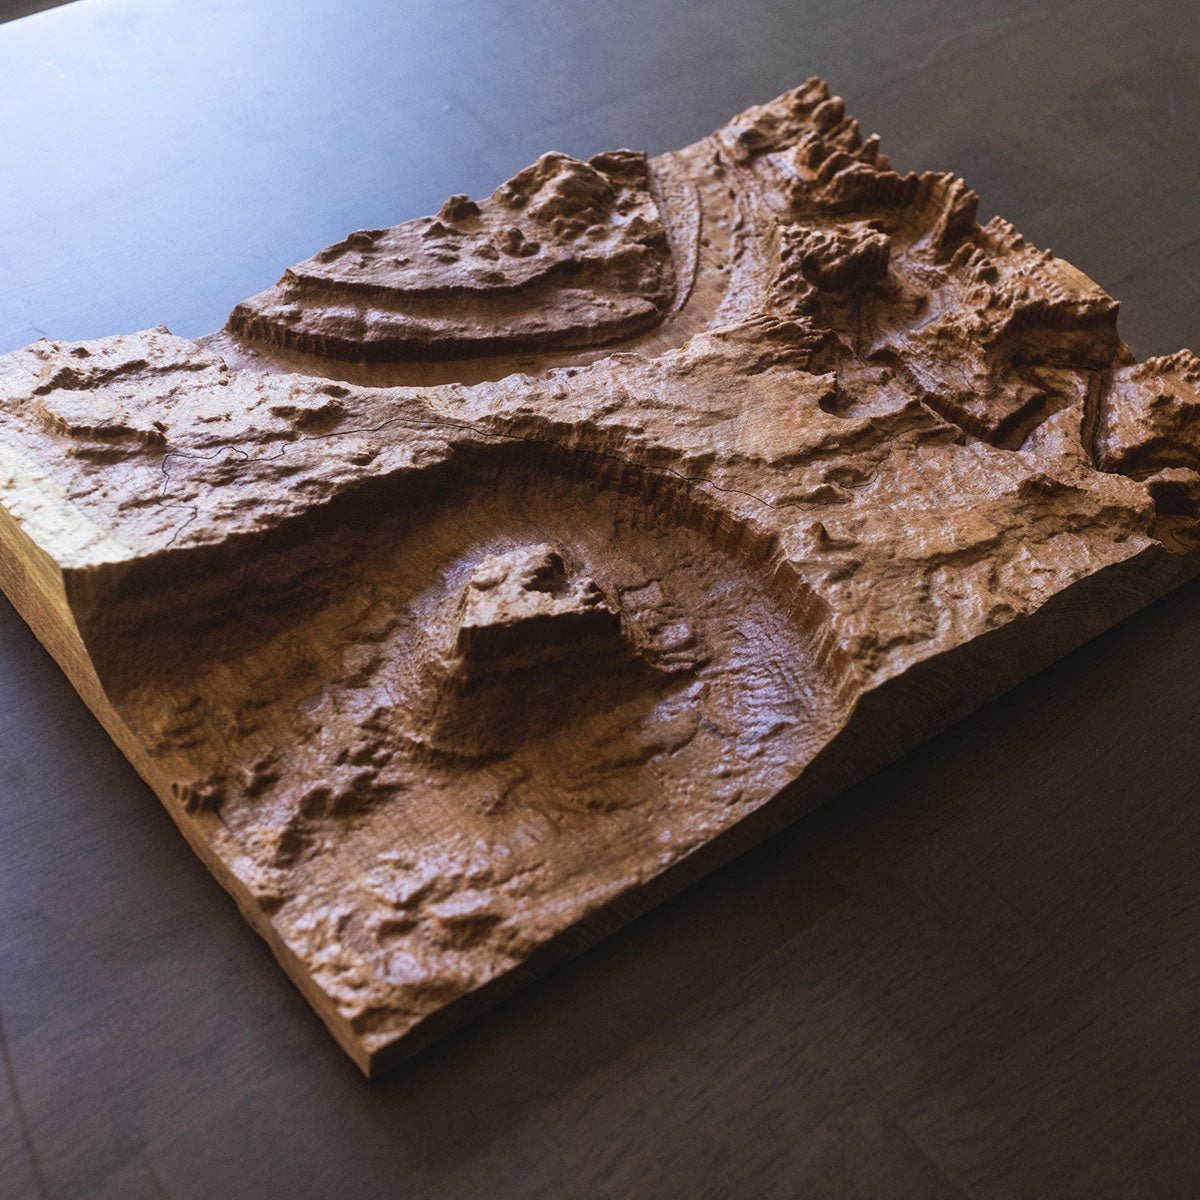
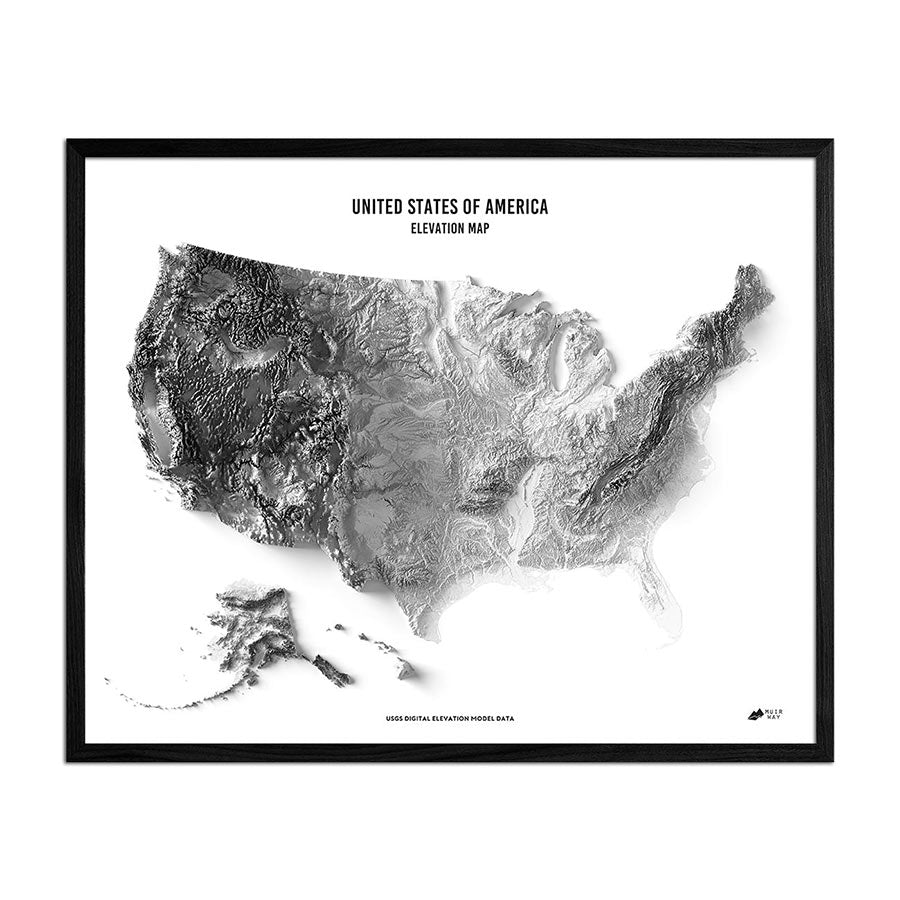
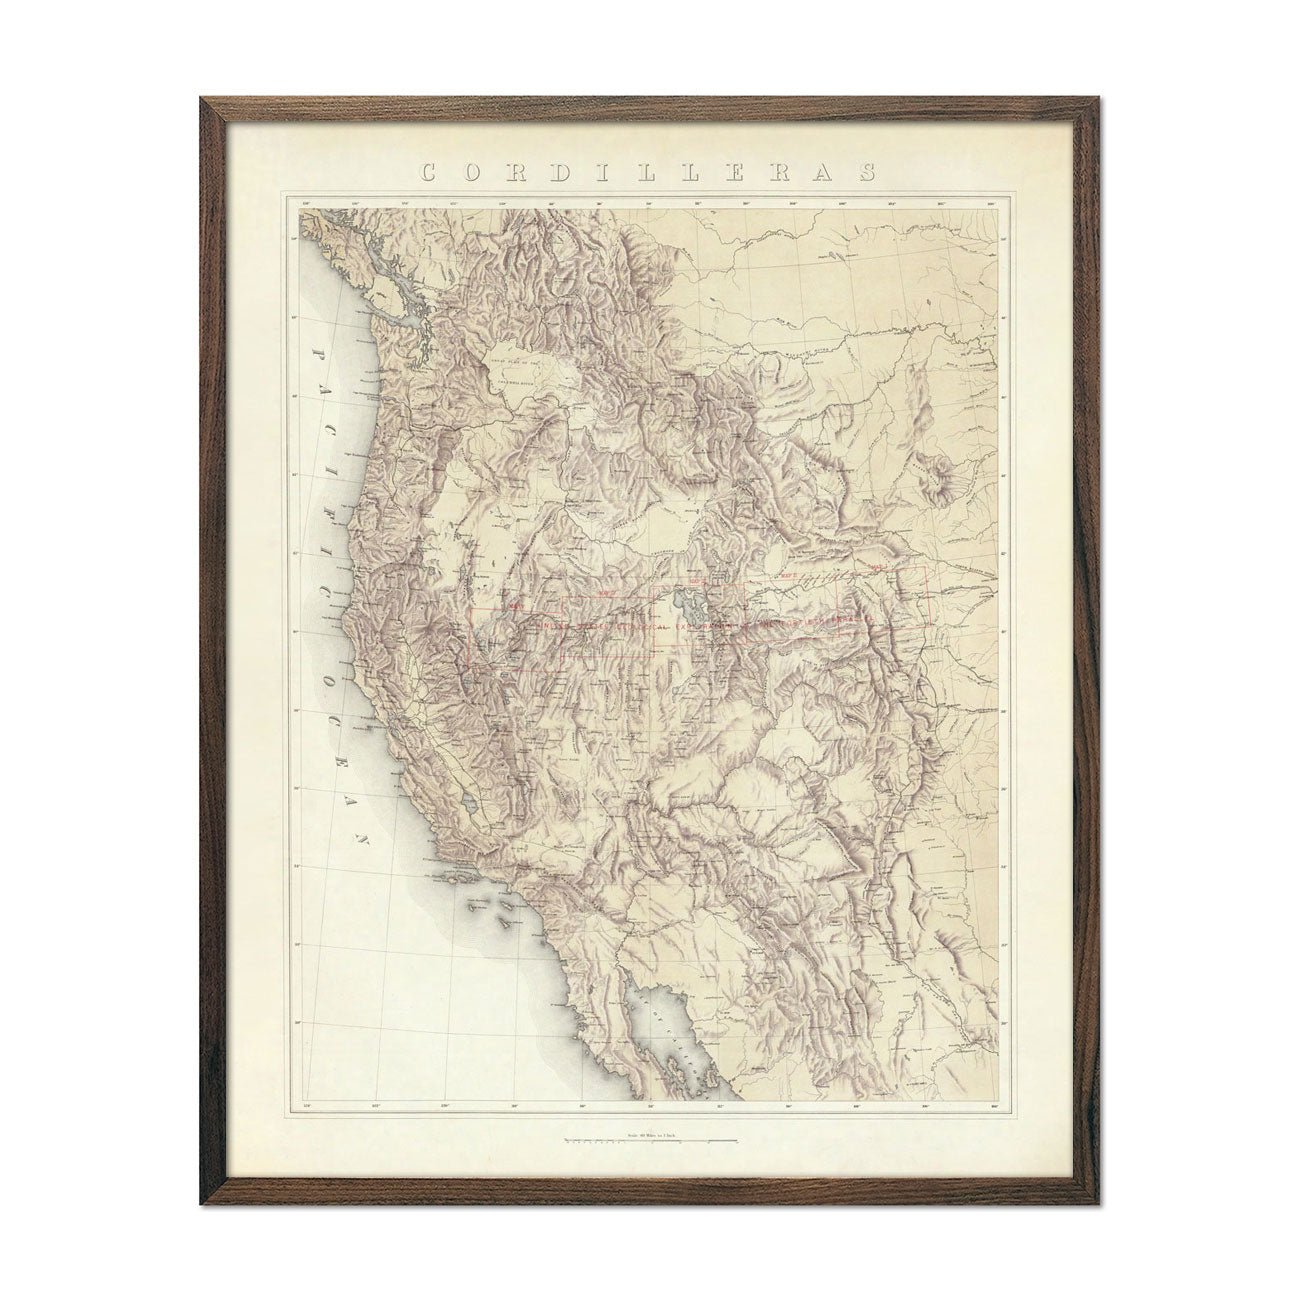
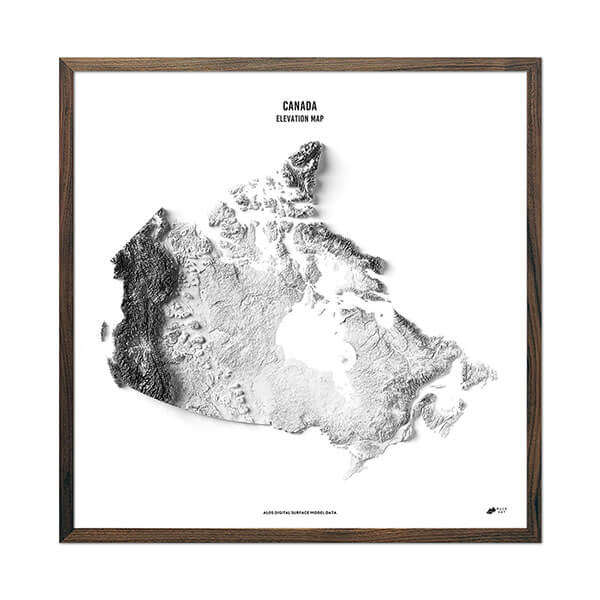
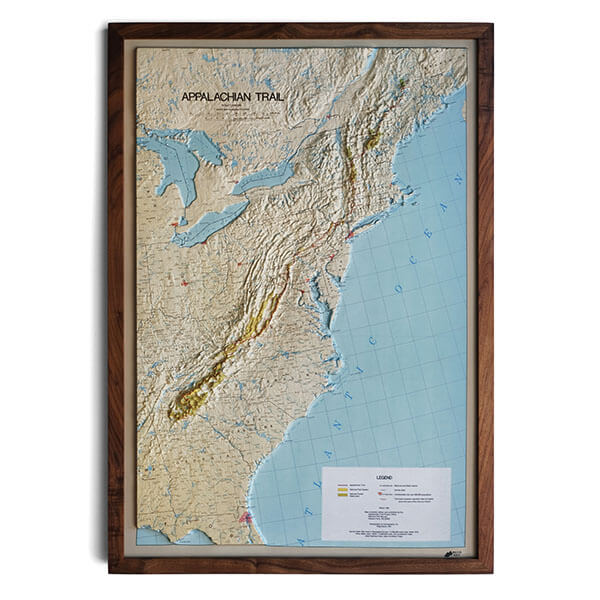
Shaded relief maps or hillshading, illustrate the real, three-dimensional landforms as accurately as possible, in a map’s two-dimensions. This is achieved by illuminating the earth’s surface with a hypothetical light source; most often from the upper-left corner. The light source casts shadows across the surface geography, resulting in a map that mirrors the landscape as if naturally observed from a considerable height, with peaks and aspects facing the light being brightly “illuminated,” and valleys being in the “shade.” Shaded relief maps create the illusion of a three-dimensional appearance on standard paper or a screen. There are also raised relief maps, that are actual, three-dimensional physical terrain models printed on plastic, raised substrate, however their graphic detailing is limited.

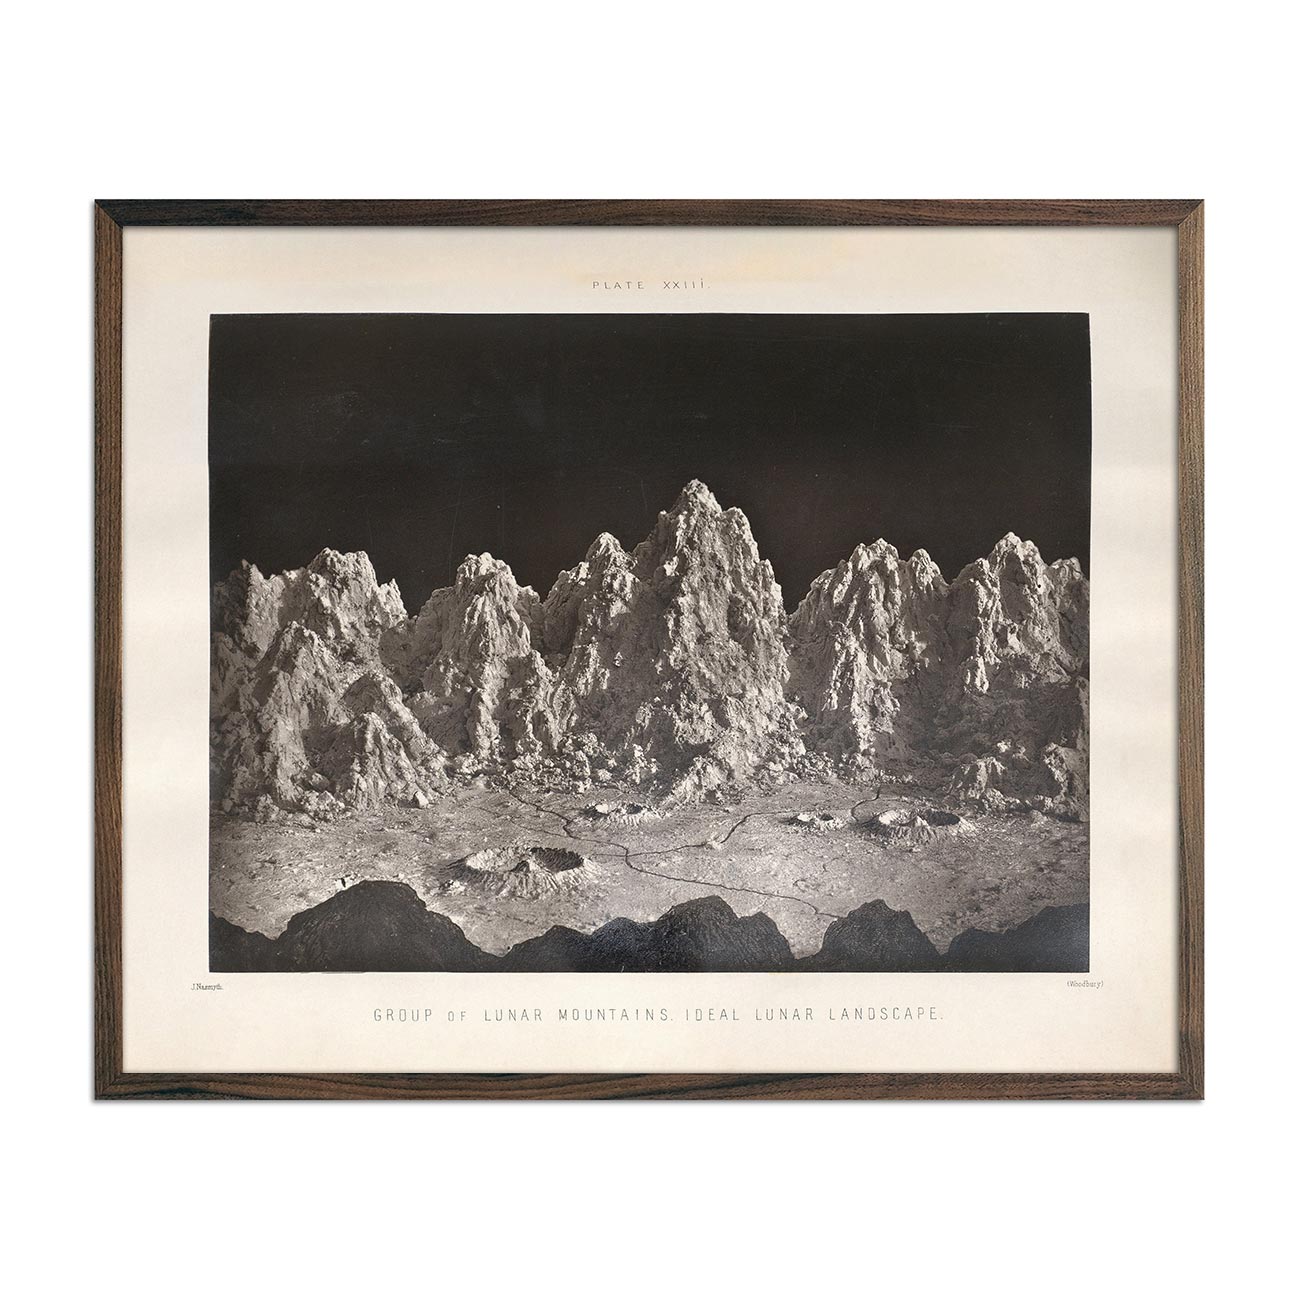
Early Relief Map Examples
One of the world’s oldest surviving maps is the Imago Mundi, or the Babylonian Map of the World, dating back to 700 and 500 BC. Found in what would have been ancient Mesopotamia, the map is carved into stone depicting Babylon at the center with surrounding geographical features. The map attempts to portray mountain relief as small rounded domes. This representational technique is known as “hill profiles,” and is used by many different civilizations during early mapping experiments, leading to more advanced approaches of showing relief.6

Raised Relief Maps
Although relief mapping continued to evolve, some societies chose to investigate the use of three-dimensional terrain models to mirror real-world geological features. China was one of the earliest civilizations that experimented making raised-relief maps. They created sculptural models made from various materials such as rice, wax, wood, or clay, to replicate the terrain they were mapping. There have been historical accounts of finding these raised-relief maps all the way back to the Qin dynasty (221-206 BCE). Other accounts of raised-relief maps were found later throughout the Middle East and Europe.
Relief Maps of Today and Tomorrow
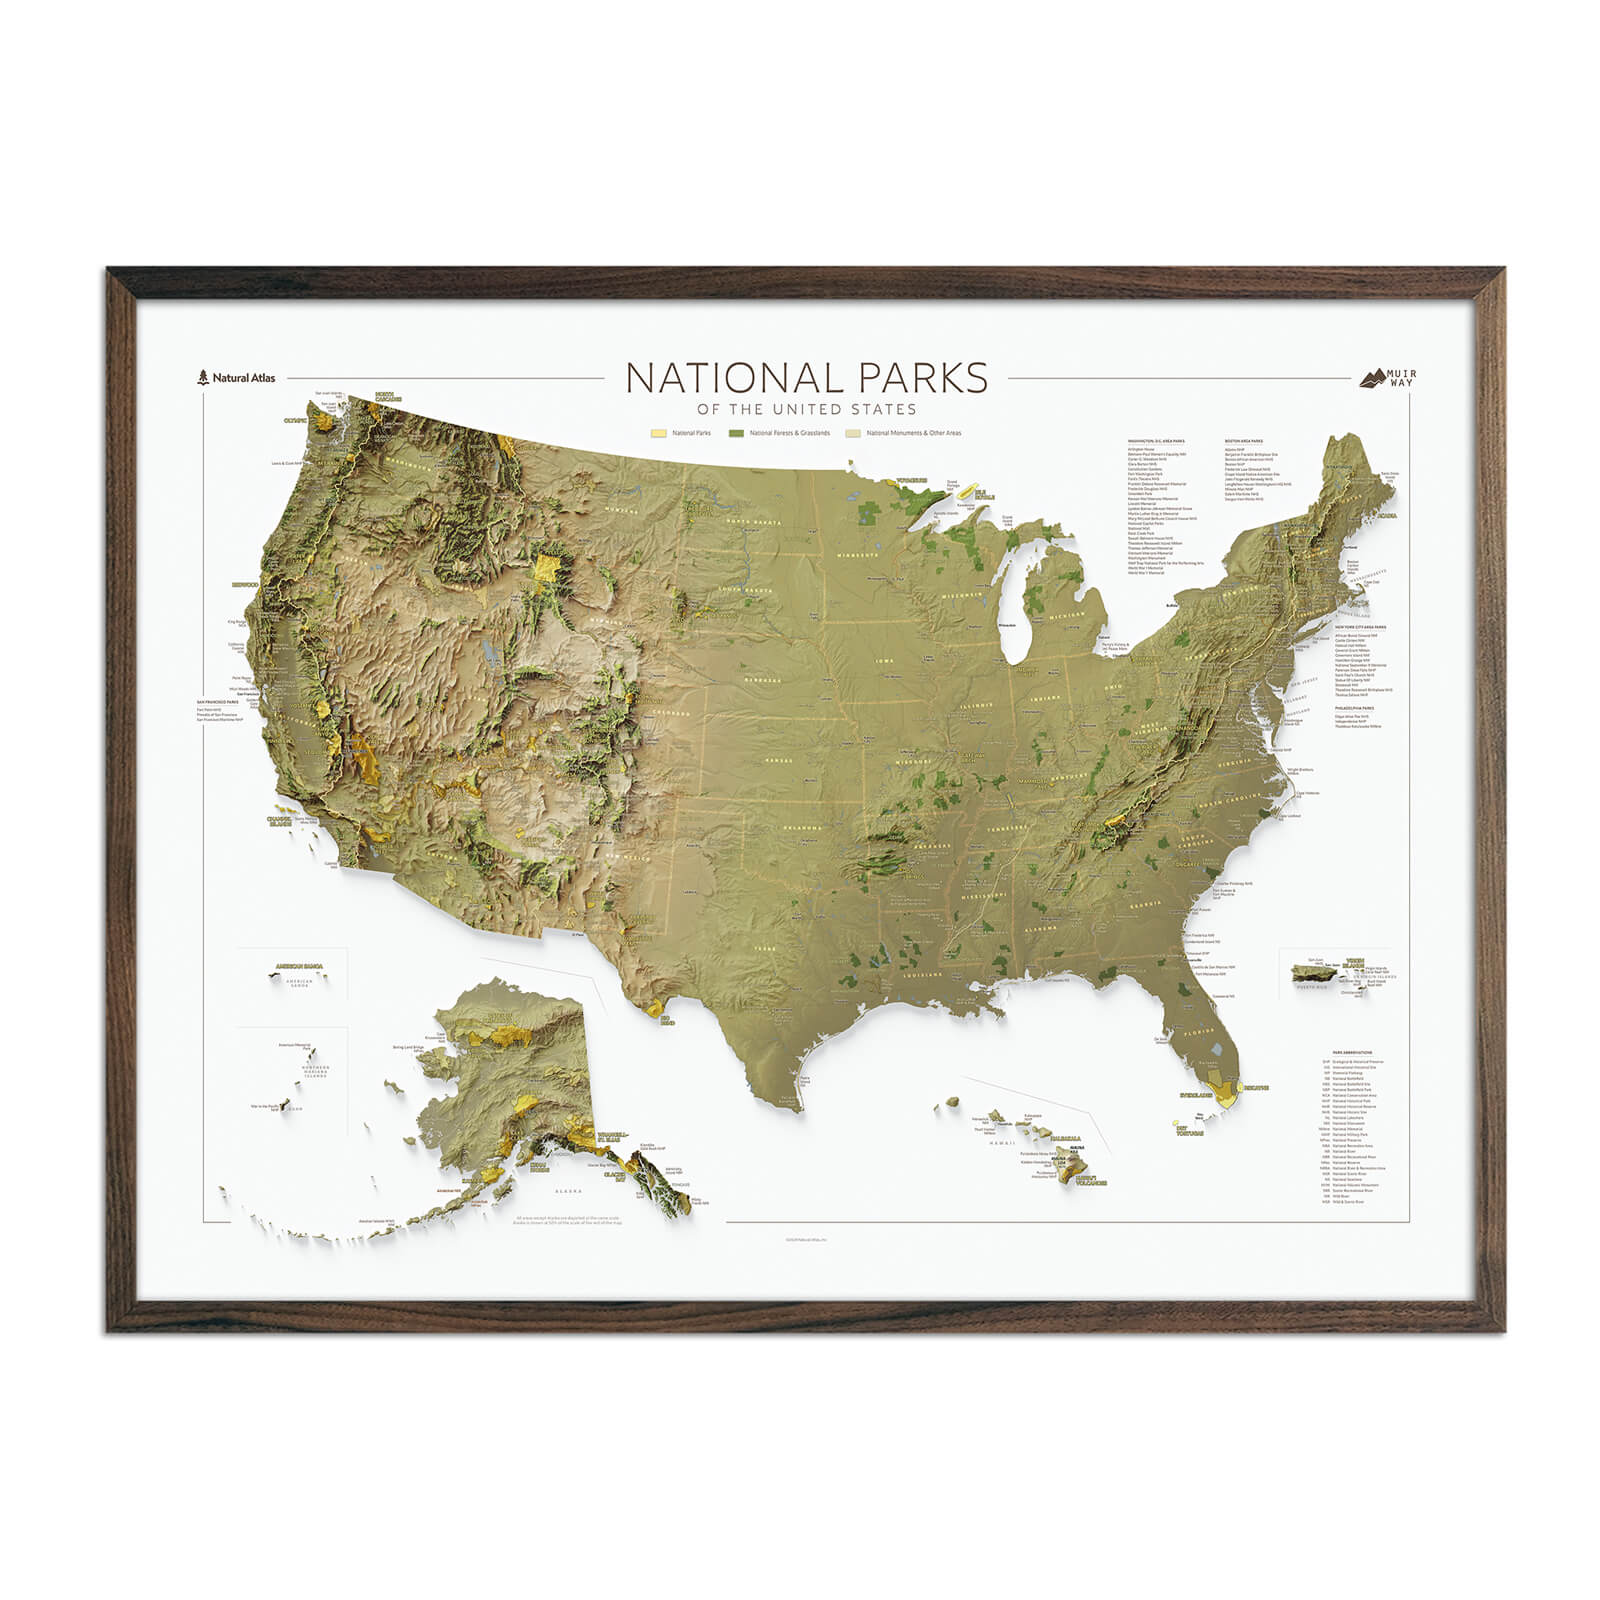
Relief maps are fundamental in cartography and geography. Today, these maps use extremely accurate scientific data to reflect earth’s dynamic structure. Relief maps realistically represent the physical world, enhancing navigation, improving communication, generating tools for planning, revealing unfamiliar territories, and documenting our history.
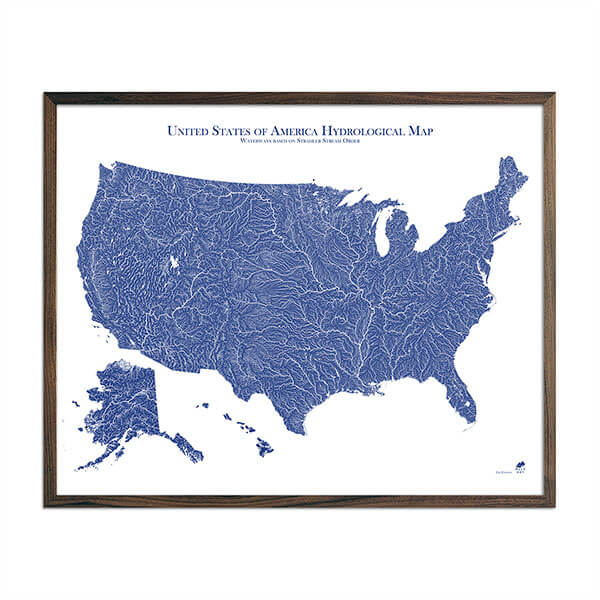
At Muir Way, we approach our collection of relief maps in a new way, combining US Geological Survey (USGS) digital elevation data, with carefully overlaid hillshade relief, for a unique effect. This method gives our maps the illusion of a real-world, three-dimensional quality, all while maintaining the positives of a more detailed and easy to use two-dimensional map. You can see our unique relief map techniques in action in our popular Elevation Maps, Vintage Relief Maps, Relief Series Maps, and many more.

 \
\
Sources:
http://www.madehow.com/Volume-4/Topographic-Map.html
https://pubs.usgs.gov/gip/topomapping/topo.html
https://project.geo.msu.edu/geogmich/relief.html
https://www.bgs.ac.uk/discovering-geology/geological-processes/relief/
https://study.com/academy/lesson/relief-map-definition-and-lesson.html
https://www.nationalgeographic.com/culture/article/mountain-elevation-maps-illustration
https://www.smithsonianmag.com/innovation/brief-history-maps-180963685/
https://china-underground.com/2016/03/07/34-beautiful-old-maps-china/
https://press.uchicago.edu/books/HOC/HOC_V2_B2/HOC_VOLUME2_Book2_chapter3.pdf
https://www.jstor.org/stable/197070?seq=1#metadata_info_tab_contents