


A world without maps is one where navigating unfamiliar terrain would be a daunting challenge, and understanding the spatial relationships between places would be nearly impossible. Thanks to cartography, this isn’t a reality human civilization has to face.
From ancient explorers charting the unknown to today's digital maps guiding us through bustling city streets, cartography has been an essential tool for human progress.
But wait - what is cartography? What does cartography mean, and what exactly does it entail? We’ll answer these questions and many others you may have about the exciting realm of cartography in this beginner’s guide to map making.
Not only will we offer a cartography definition, but we’ll pull the curtain back as we introduce you to the role of a cartographer. You’ll learn all about cartography tools and techniques, the connection between geography and cartography, the various types of maps that cartographers create, and much, much more.
We’ve got a lot to cover in this guide, so let’s start in the most logical place possible: what is cartography, exactly?
What is Cartography? Definition, Synonyms, and More
You likely already realize that cartography has something to do with maps…but below, we’ll define cartography and help you gain a crystal clear understanding of what this practice is all about.
What is the Cartography Definition?
So, what is cartography? The cartography definition has been made more and more complex over the years - but we’re going to keep it fairly simple for you. Cartography, at its core, is the art and science of creating and using maps to represent the physical world.
This multifaceted discipline integrates elements of geography, design, and technology to depict spatial relationships, communicate complex information, and guide us through both familiar and uncharted territories.
The term “cartography” originates from the Greek words “chartēs,” meaning “papyrus” or “sheet,” and “graphein,” which means “to write” or “to draw.” In essence, cartography is the practice of drawing the world on paper - or, in today's digital age, on screens. Let’s hop in a time portal and look at the history of this practice.
A Brief History of Cartography
The history of cartography spans millennia, with the earliest known maps dating back to around 6000 BC. The ancient Greeks refined cartography, using maps to calculate Earth's circumference and introducing mathematical principles like coordinates. Ptolemy's map in 150 AD, for example, used longitudinal and latitudinal lines, which are still central to modern cartography.
Muslim cartographers in the 16th century built upon Ptolemy's foundation to expand Muslim rule. During the Age of Exploration, navigators like Columbus, da Gama, and Magellan relied on increasingly accurate maps crafted by skilled mapmakers such as Mercator and Ortelius.

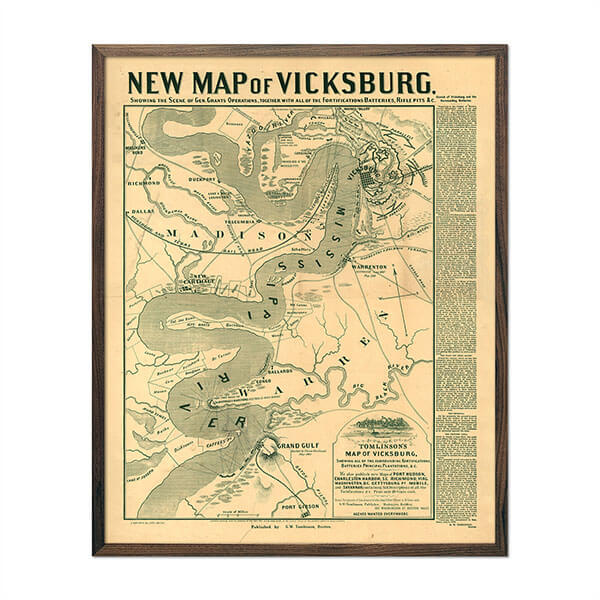
The US industrial revolution and the rise of leisure travel further spurred cartographic advancements. Key US military victories can also be attributed to the role of cartography. The 20th century saw innovations like GPS and LiDAR revolutionize cartography, with urban planners now heavily relying on maps for community-based decision-making.
Cartography, a vital practice, has guided generations of travelers, explorers, and scholars. So, who are the people responsible for creating these invaluable tools? What is a person who does cartography called?
What is a Person Who Does Cartography Called?
You’ve likely seen the term “cartographer” used a few times throughout our guide thus far. What is a cartographer, though? Simple - a person who practices cartography.
Cartographers possess a unique combination of skills and knowledge, blending their understanding of geography and spatial relationships with artistic talent and technical proficiency.
We’ll talk more about the techniques cartographers use in their profession shortly, along with the different types of maps they make. First, let’s quickly touch on the connection between geography and cartography.
The Connection Between Geography and Cartography
Geography and cartography, often mistakenly considered the same, are separate yet intertwined disciplines. Geography is a broader field, encompassing the study of Earth's physical features, natural systems, human societies, and their interactions.
Geographers use various techniques, such as fieldwork and statistical analysis, to explore these elements. In contrast, cartography is a specialized field within geography, focusing on designing and producing maps to communicate geographic information effectively.
The Relationship Between Geography and Cartography
Geography and cartography share a deep connection as they both study and represent Earth's surface. Geography investigates spatial patterns and relationships, while cartography brings these interpretations to life through maps. Geographic practices inform cartographic techniques, making complex geographic data more accessible.
While geographic research generates the raw data and insights for cartographic design, cartography allows geographers to visualize and communicate their findings in a user-friendly format.
The rise of technology, such as Geographic Information Systems (GIS), has strengthened this relationship, enabling geographers and cartographers to collaborate seamlessly, leading to advancements in both fields.
Now that we've explored the connection between geography and cartography, let's discuss the four main elements of cartographic design.
The Four Elements of Cartographic Design

The process behind bringing a map to life is a lot more complex and thoughtful than you may realize. But, the end result can be attributed to four basic elements: map scale & projection, symbolization & color schemes, topography & labeling, and visual hierarchy & composition.
By skillfully combining these four elements of cartographic design, cartographers create maps that are not only visually engaging but also effective in conveying complex geographic information.
Map Scale and Projection
Map scale is the relationship between distances on the map and their corresponding distances in the real world. It is typically represented as a ratio (e.g., 1:100,000) or a representative fraction.
Cartographers must select an appropriate scale based on the purpose of the map and the level of detail required. Large-scale maps depict smaller areas with greater detail, while small-scale maps cover larger areas but with less detail.
Projection is the method used to represent the curved surface of the Earth on a flat map. Since no projection can perfectly preserve all spatial properties, cartographers must choose a suitable projection that minimizes distortion and meets the specific needs of the map.
Common types of projections include cylindrical, conic, and azimuthal, each with its unique advantages and limitations.
Symbolization and Color Schemes
Symbolization is the process of visually representing geographic features and attributes on a map using symbols, such as points, lines, and polygons. Cartographers must choose symbols that effectively communicate the information being presented, while also creating a visually appealing design.
Color schemes play a crucial role in enhancing the readability and aesthetics of a map. Cartographers often use color to represent various data categories or to indicate different types of features.
When selecting colors, cartographers should consider factors such as color harmony, contrast, and accessibility for colorblind users. Sequential, diverging, and qualitative color schemes are commonly employed to represent different types of data.
Typography and Labeling
These essential components of cartographic design contribute to a map's readability and visual appeal. Text is often used to describe geographic features, provide context, and convey additional information.
When choosing fonts and text styles, cartographers must consider factors such as legibility, hierarchy, and aesthetics. Label placement is also critical, as it can influence the clarity and balance of the map.
There is a fine line between providing all this context and overwhelming the map. Cartographers must carefully position labels to find this balance.
Visual Hierarchy and Composition
These fundamental principles of cartographic design guide the viewer's eye and facilitate the interpretation of the map. Visual hierarchy is created by emphasizing the most important features or information using techniques such as size, color, contrast, and arrangement.
Composition refers to the overall arrangement and balance of elements on the map, including features, labels, and ancillary elements such as legends, scale bars, and north arrows. Effective composition ensures that the map is visually harmonious and easy to navigate, guiding the viewer's eye through the information in a logical and intuitive manner.
The Different Types of Maps and Cartographic Representations

As you can imagine, there are different maps for different purposes. While some are used to emphasize specific data points (climate, population density, etc.), others are used for navigation of certain areas - like water or air. Below, we’ll introduce you to the most common maps cartographers make.
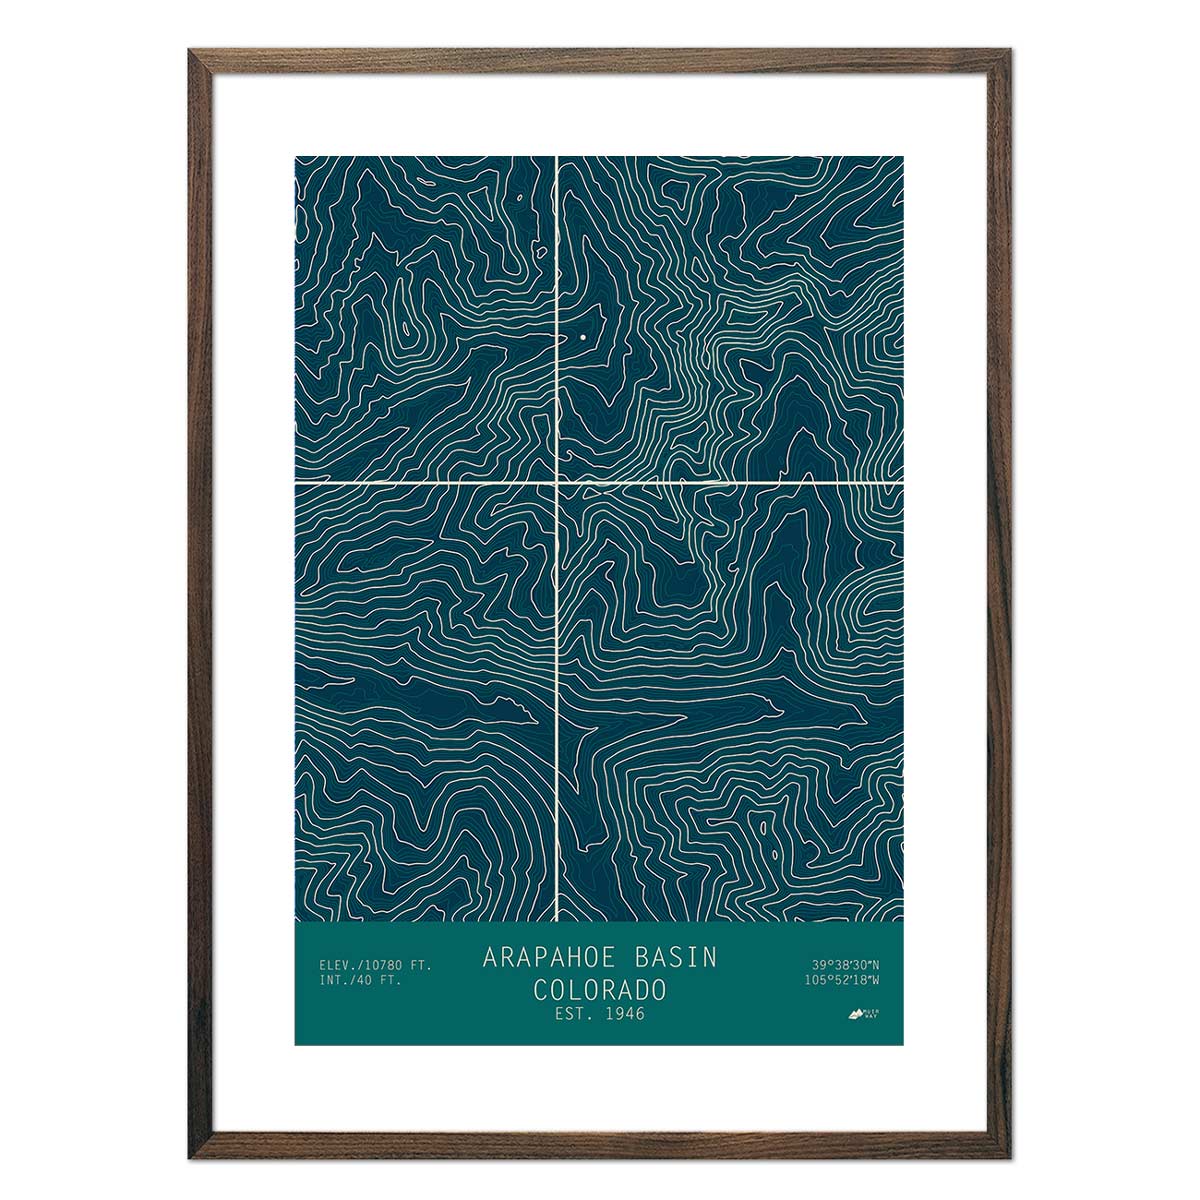
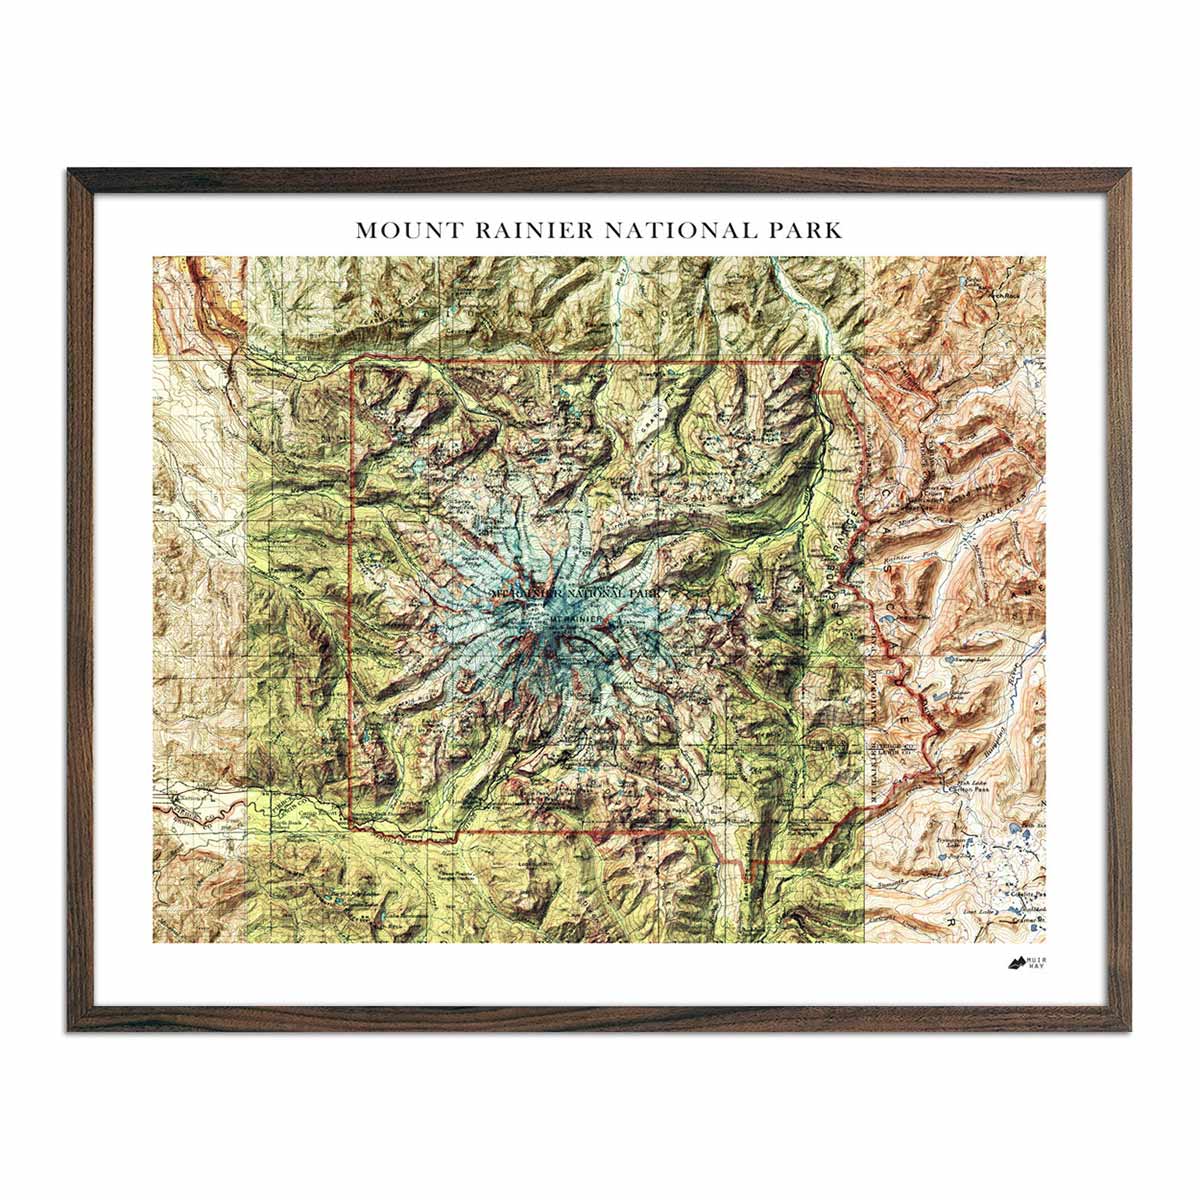
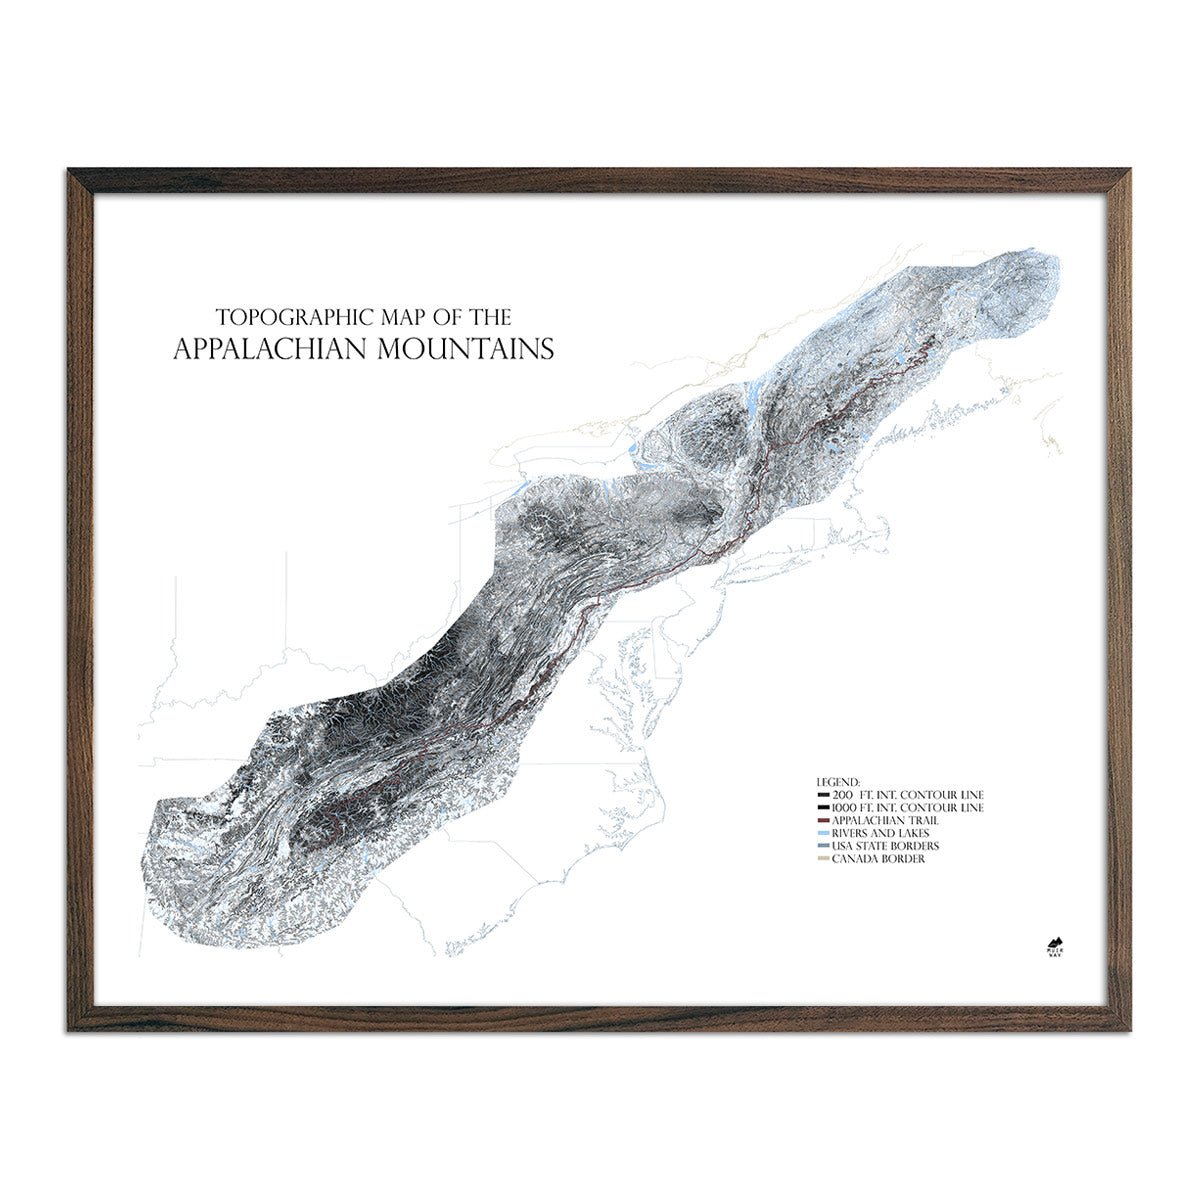
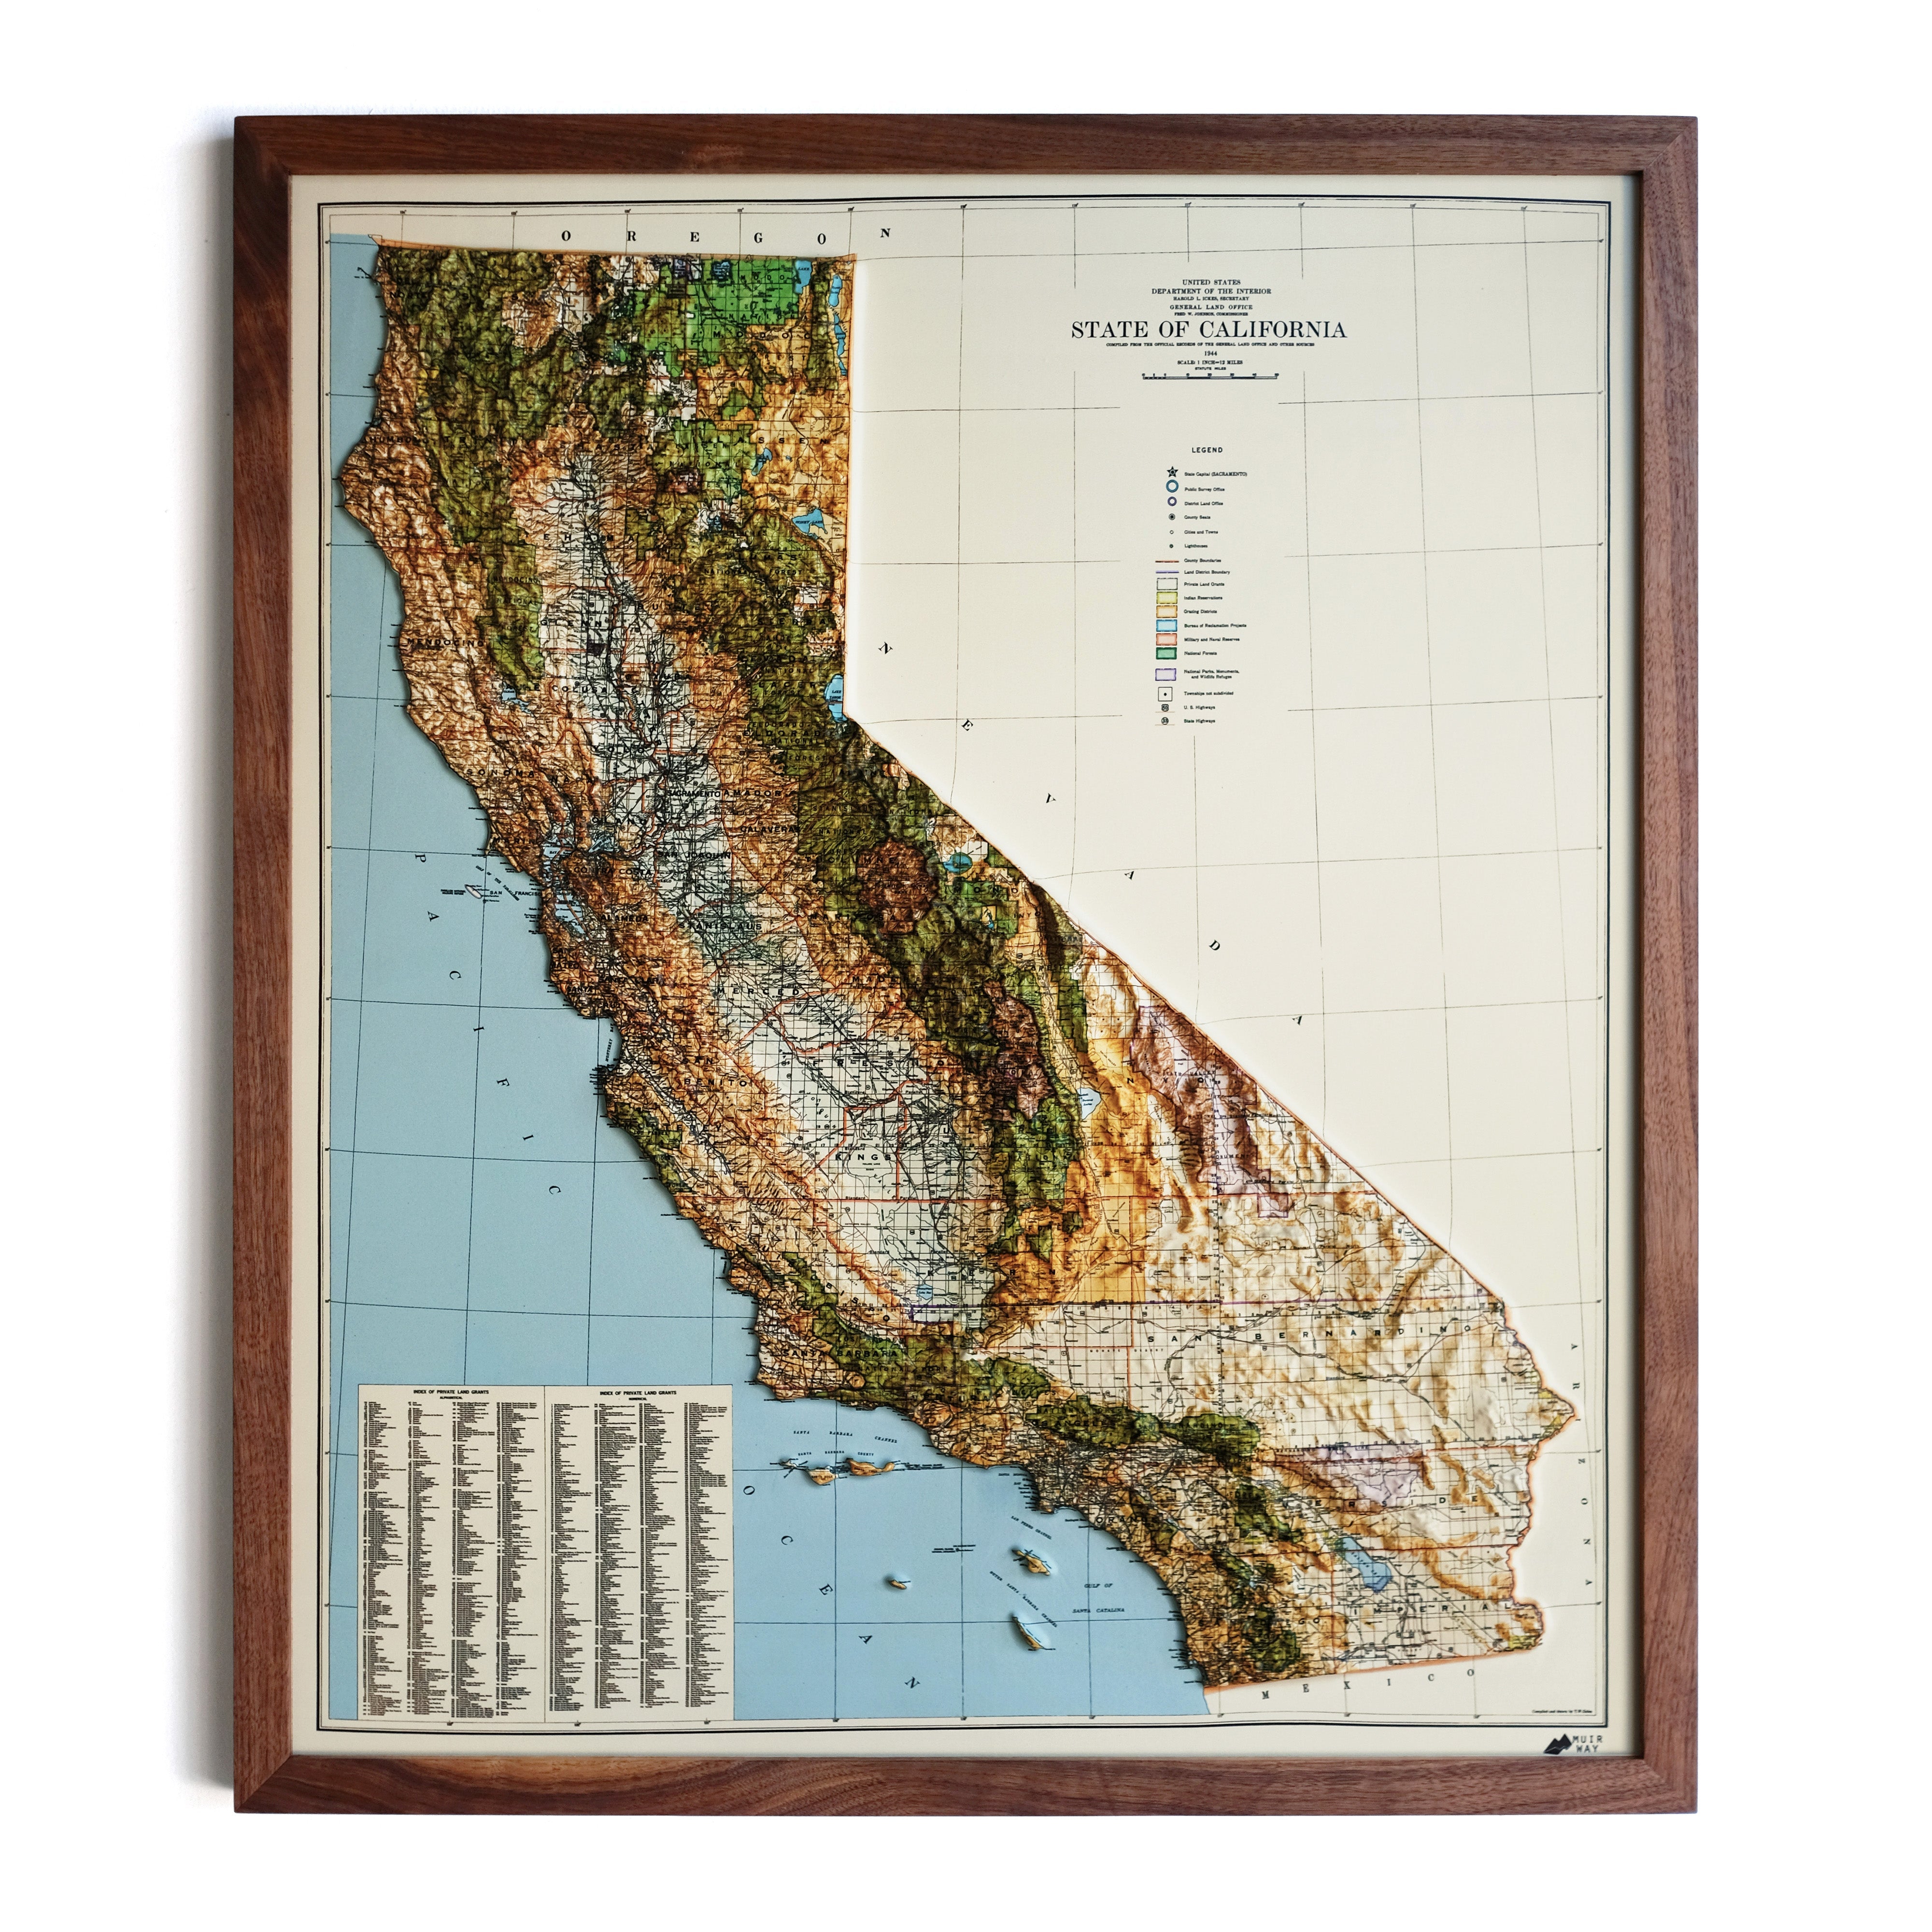
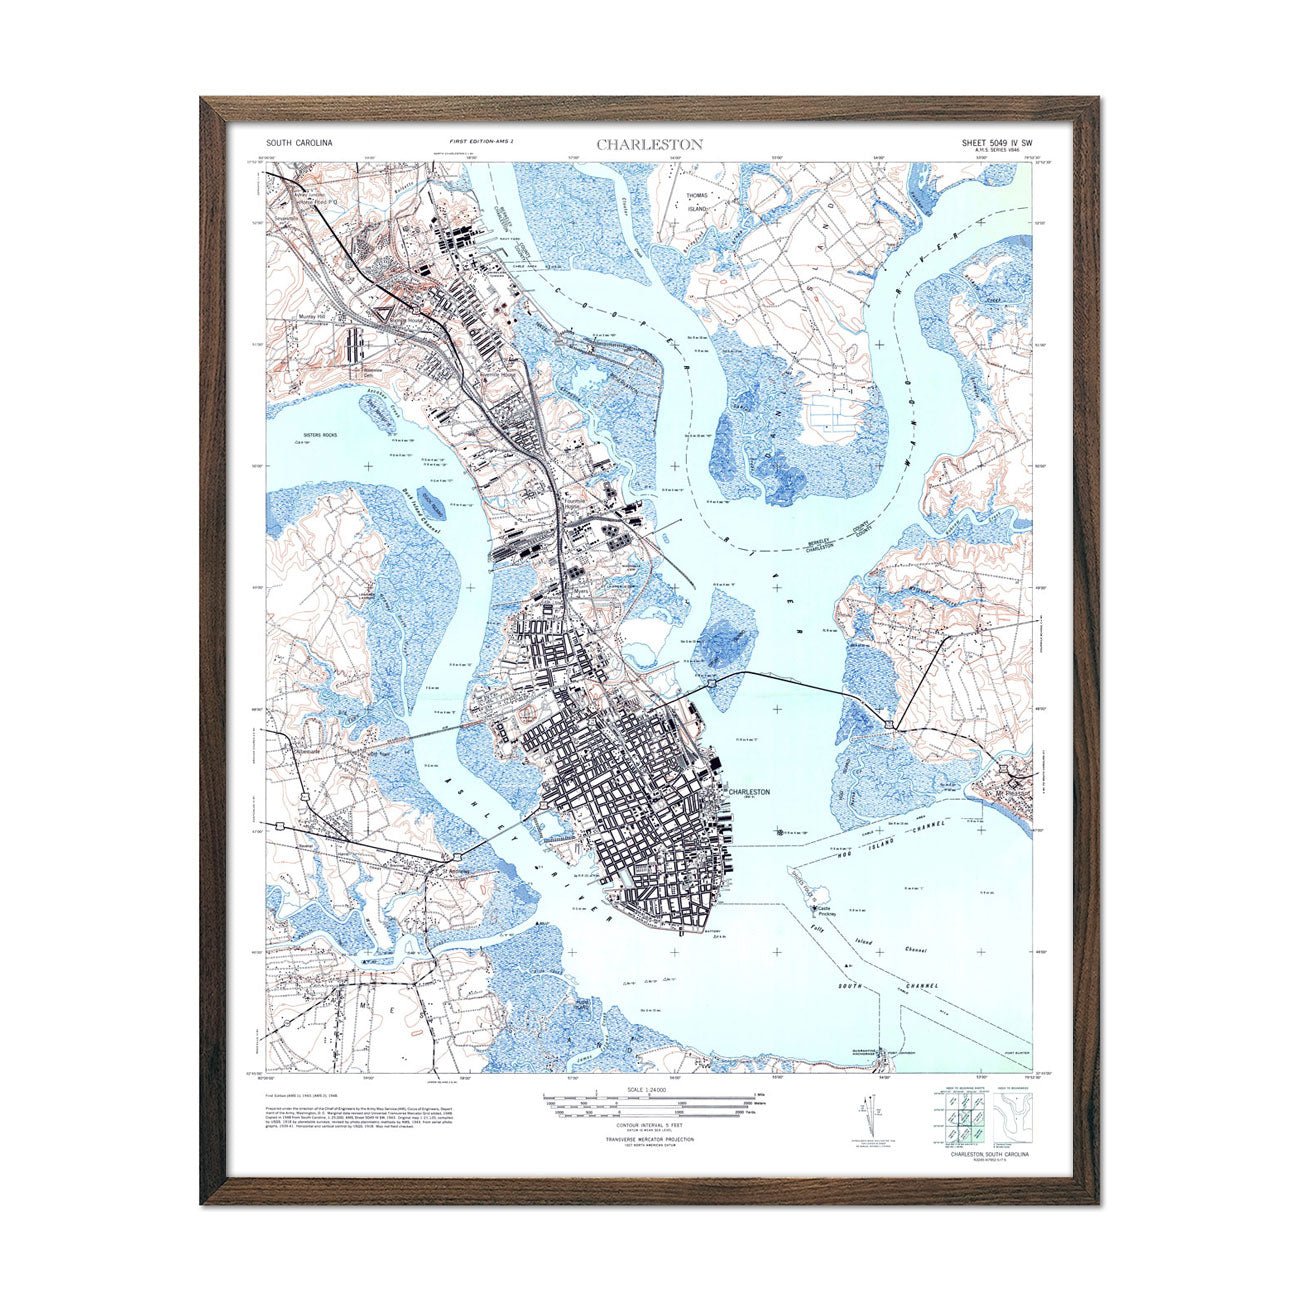
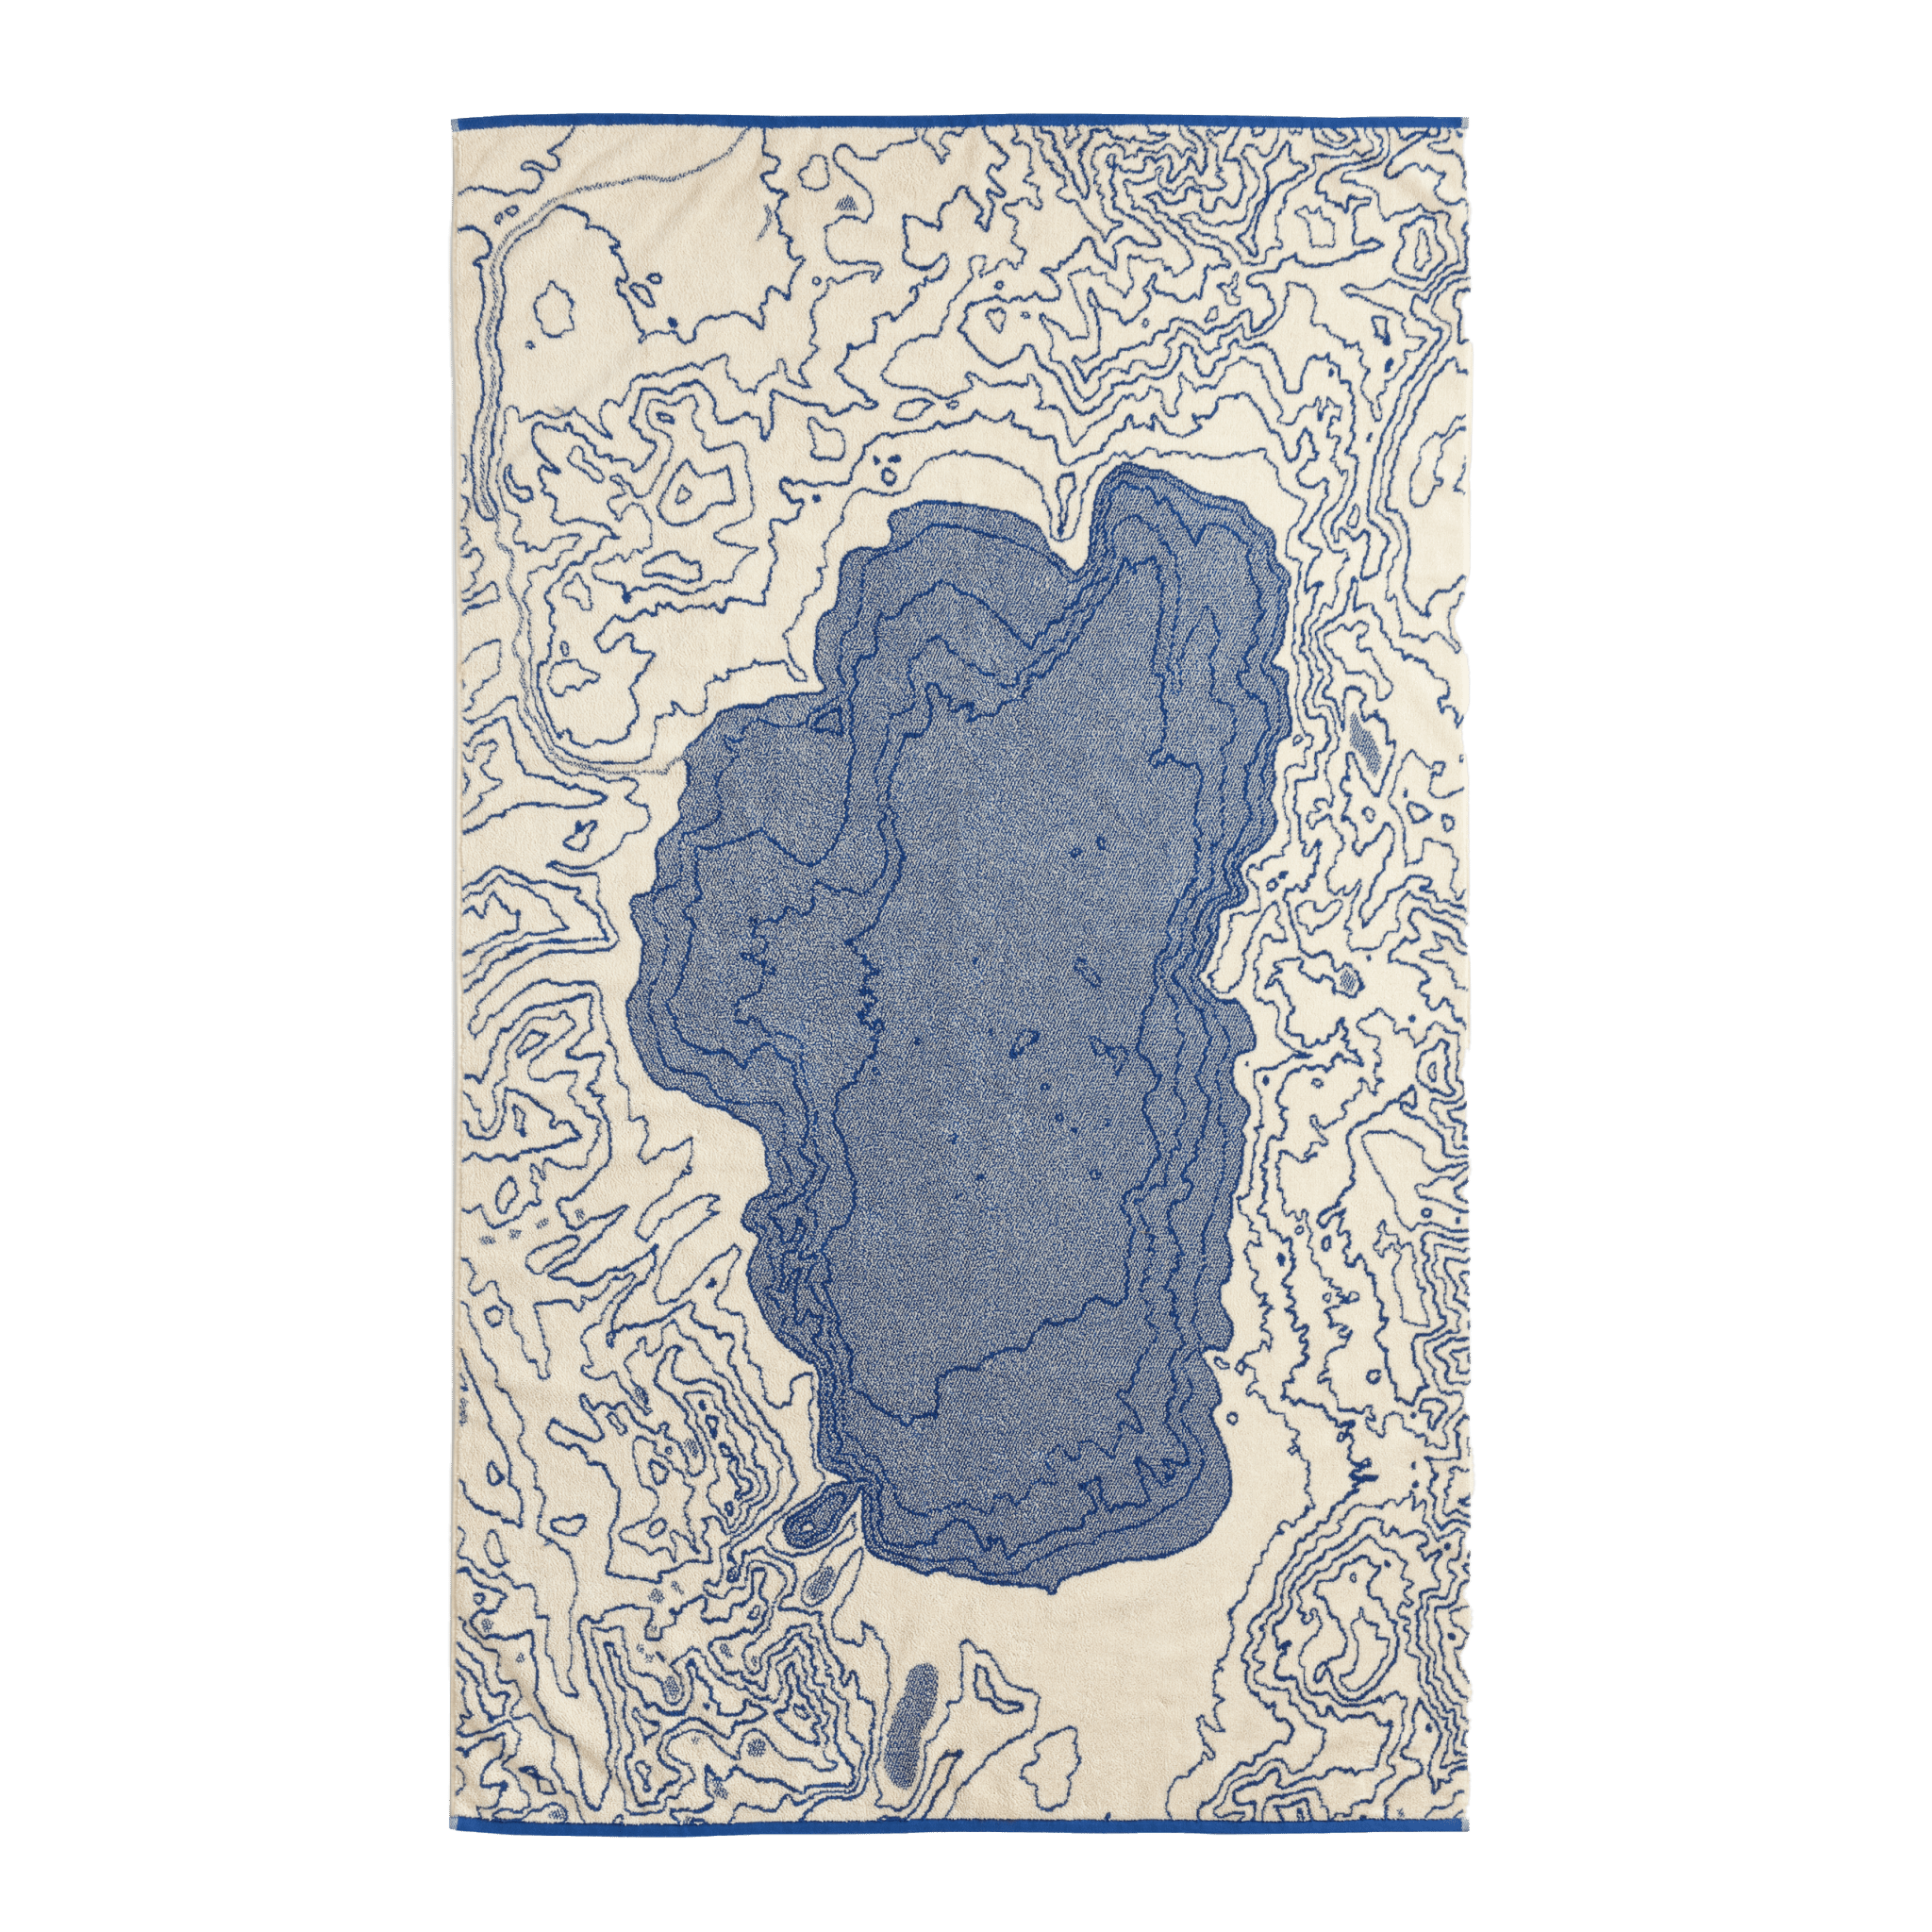
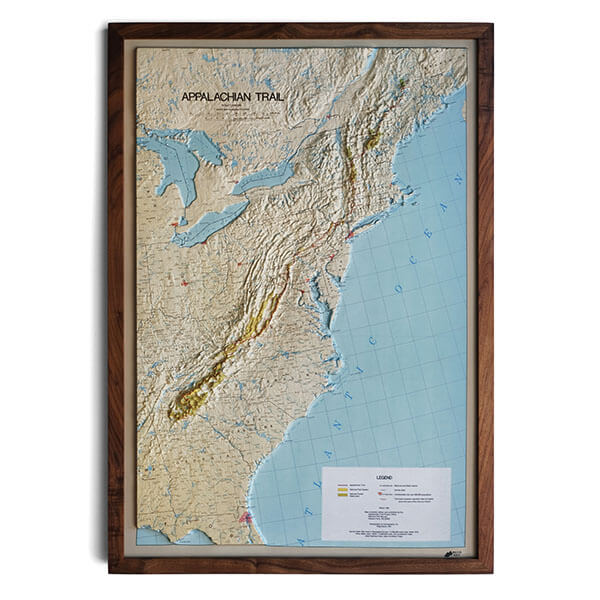
Topographic Maps
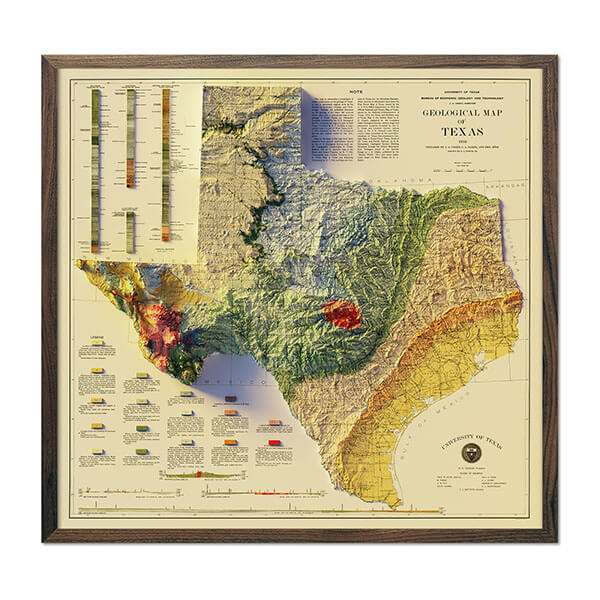
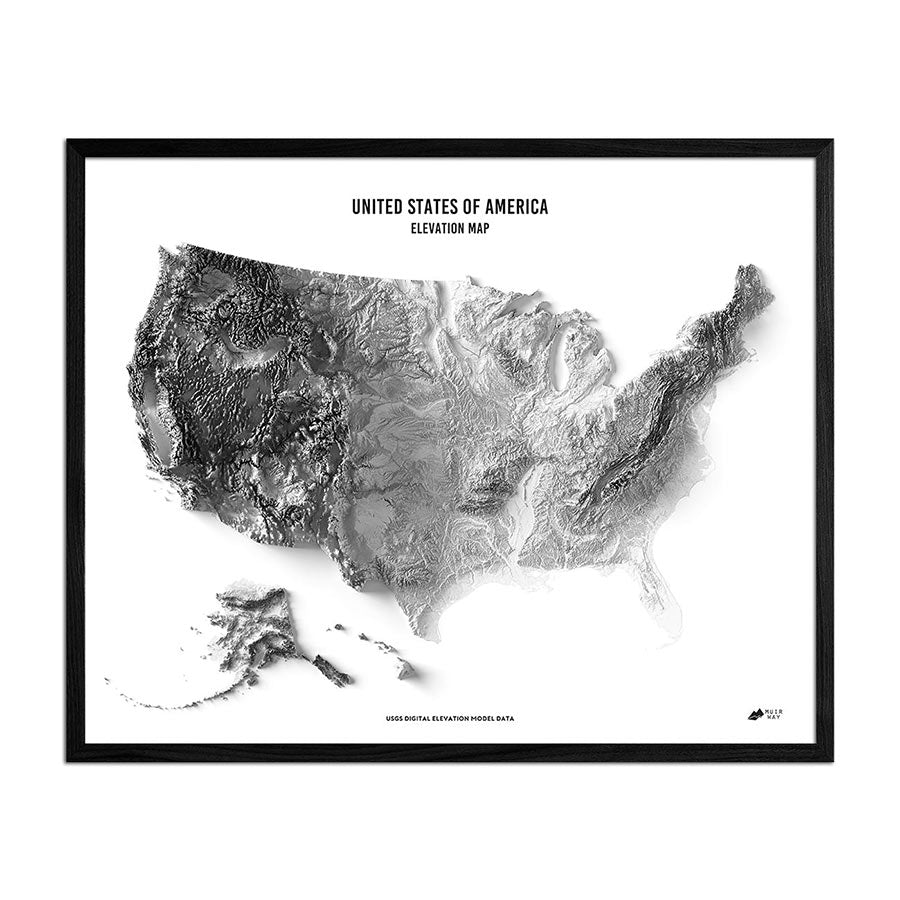
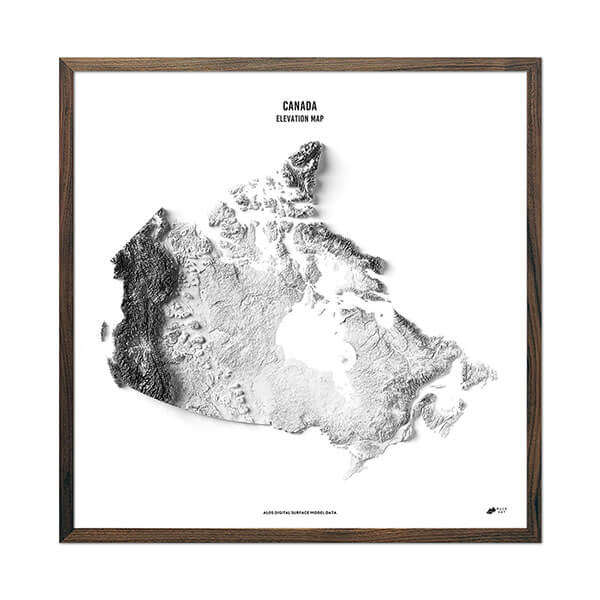
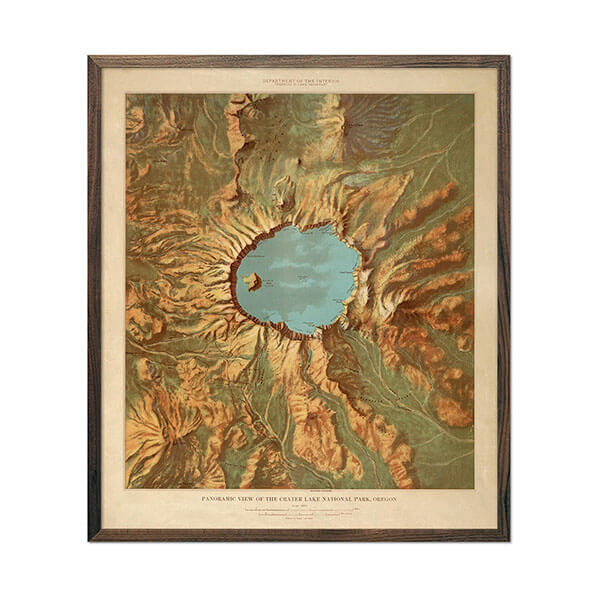
Topographic maps display the Earth's natural and human-made features, with a focus on elevation and terrain. They use contour lines to represent elevation changes and symbols to depict features like roads, rivers, and landmarks. These maps are invaluable for outdoor enthusiasts, urban planners, and engineers alike.
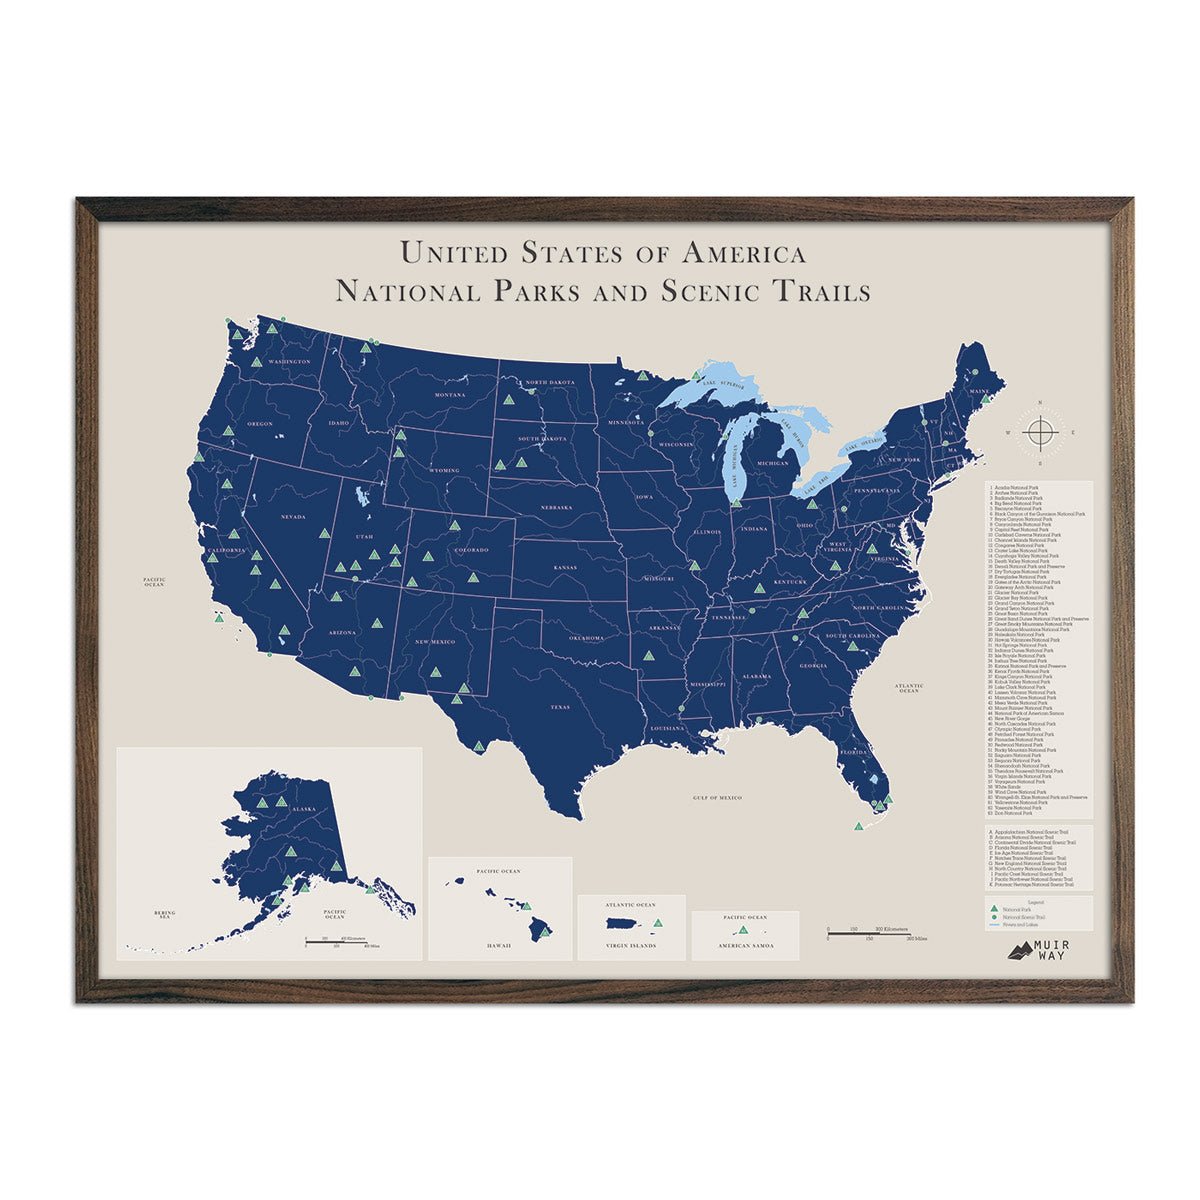
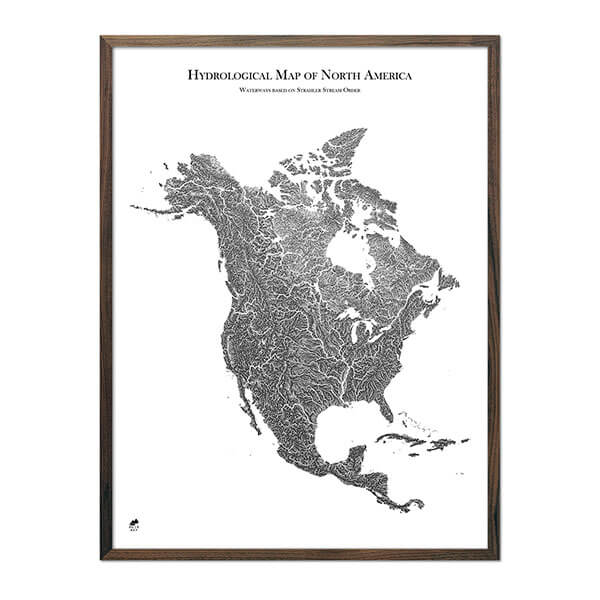
Thematic Maps
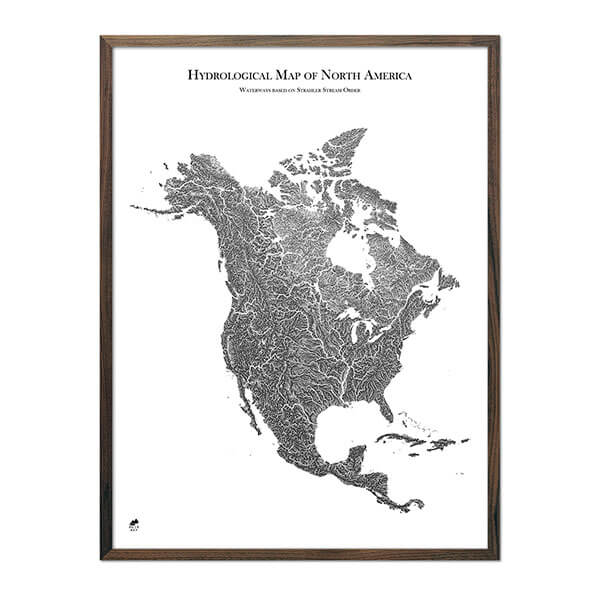
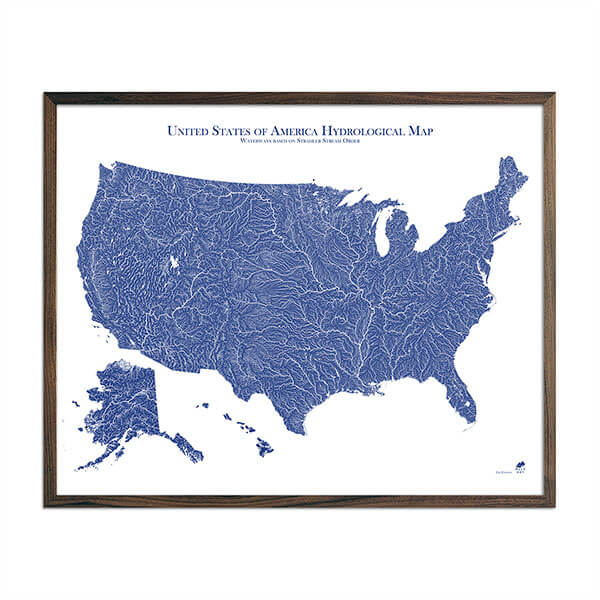
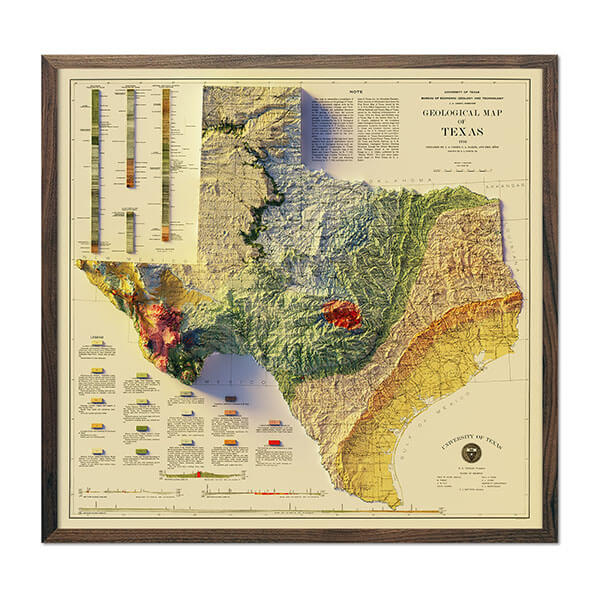
Thematic maps emphasize specific spatial patterns or data relationships, such as population density, climate, or economic activity. They can be displayed via choropleth, proportional symbols, or flow maps. These are widely used in research, decision-making, and education to visualize and analyze complex data.
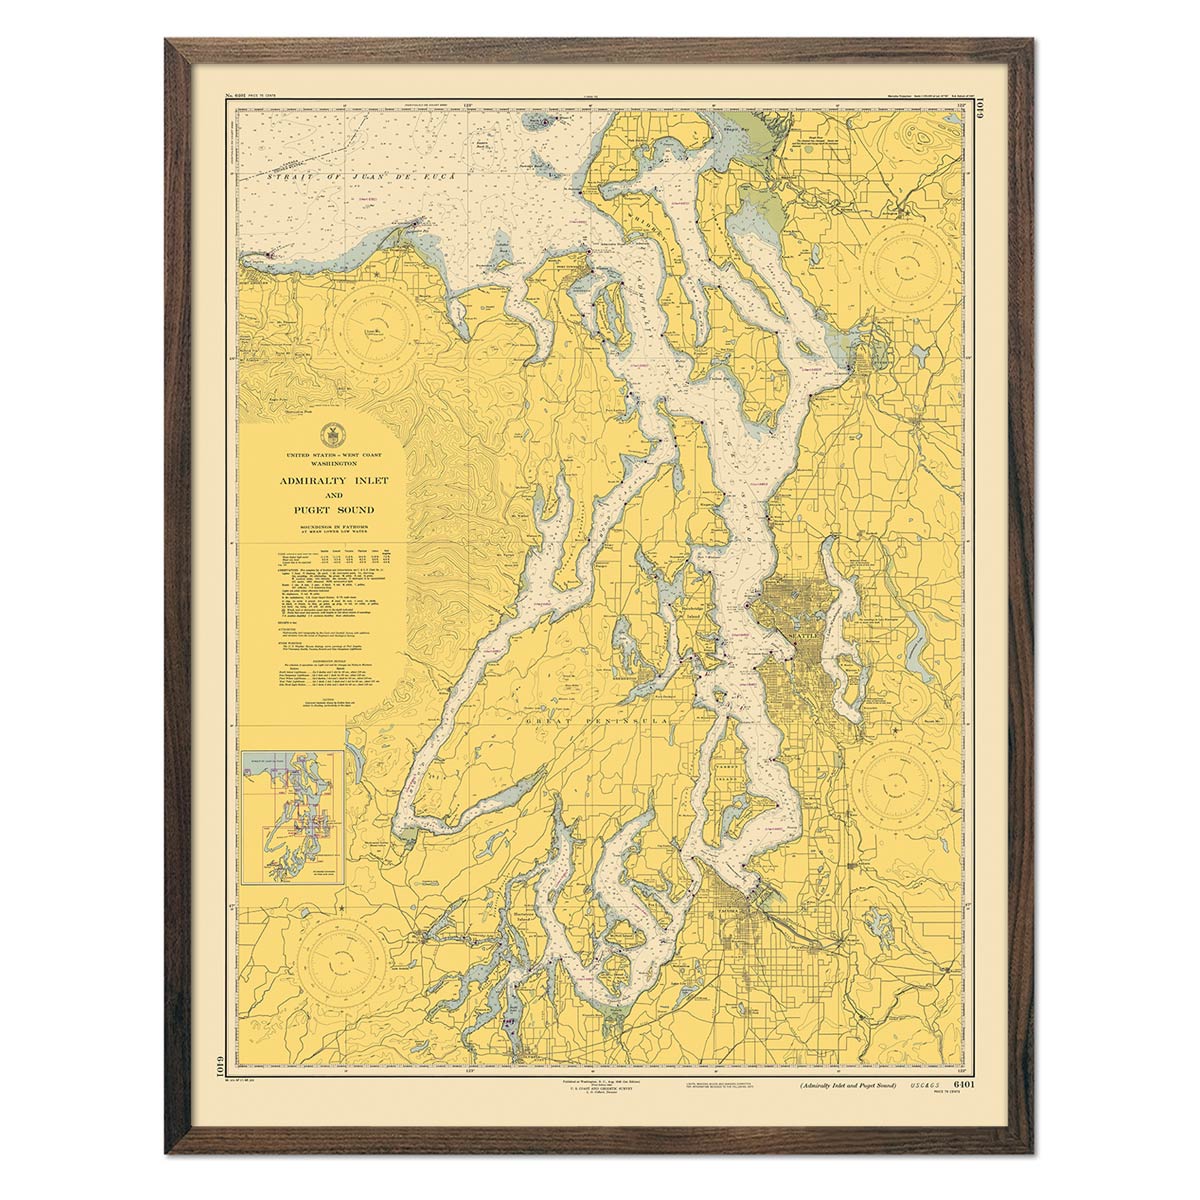
Nautical and Aeronautical Charts
These are specialized maps designed for navigation on water or in the air. Nautical charts depict information like water depths, shoreline features, and navigational hazards, while aeronautical charts show air routes, altitude restrictions, and airport locations. These charts are essential tools for mariners and pilots, ensuring safe and efficient travel.
Digital and Interactive Maps
Digital and interactive maps leverage modern technology to create dynamic, customizable representations. They include features like zooming, panning, and layer control, allowing users to explore and analyze geographic data at their own pace. Web mapping platforms like Google Maps and OpenStreetMap are popular examples of digital and interactive maps that have transformed the way we navigate and understand the world.
Geospatial Data Visualization
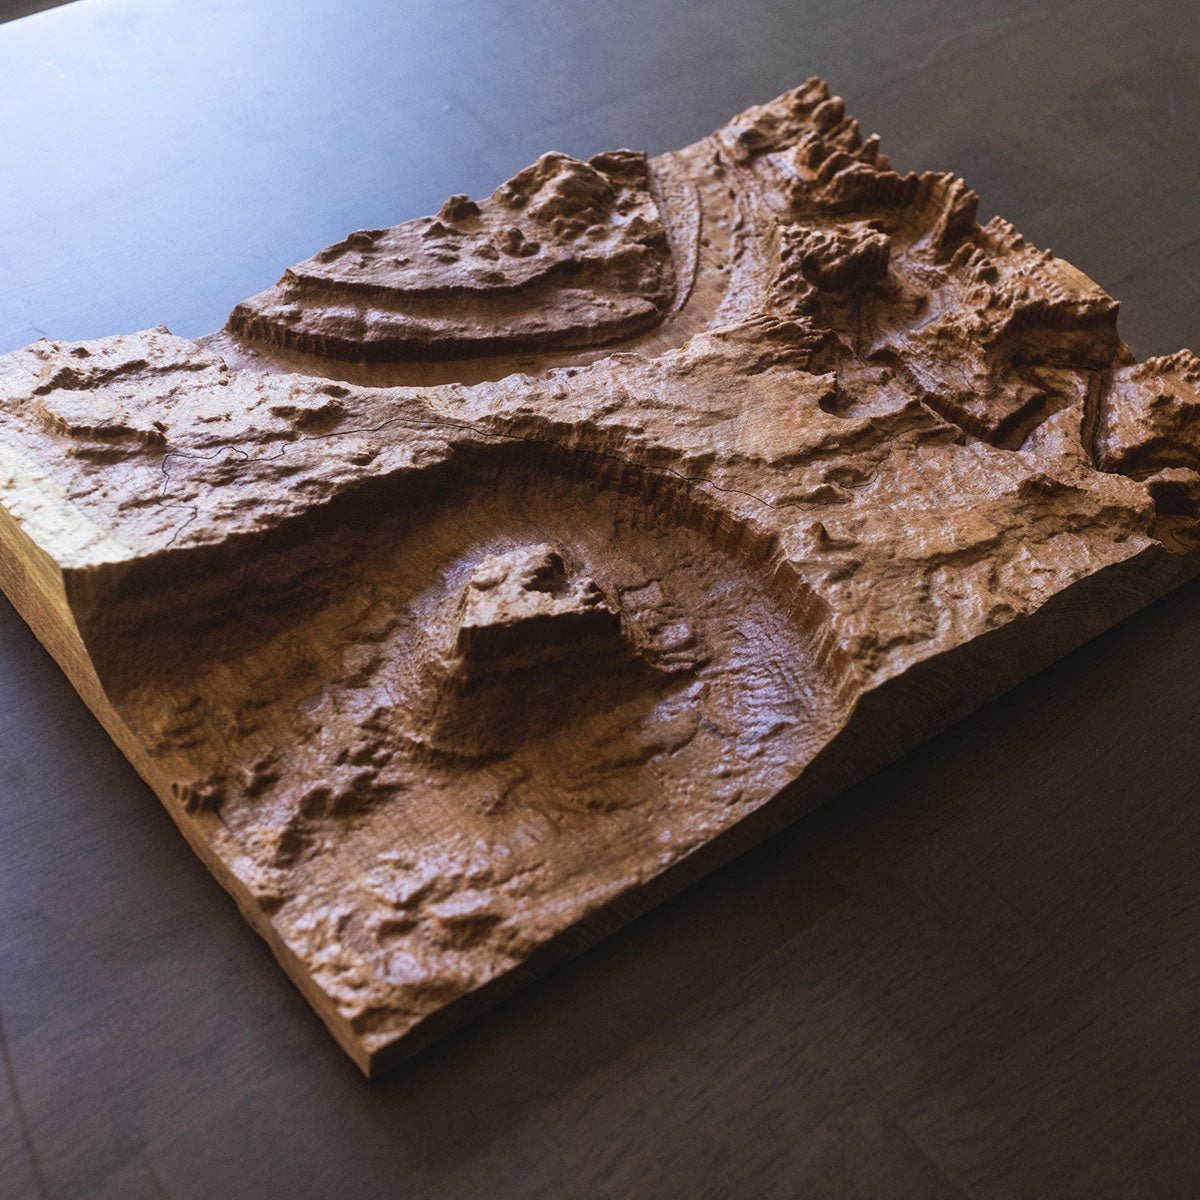
Geospatial data visualization involves using maps and other graphical tools to represent geographic data in an engaging and informative manner. This can include techniques like heatmaps, 3D modeling, and animated maps.
All of this helps make complex data more accessible, enabling better decision-making and communication across various fields, from urban planning to environmental management.
The Various Cartographic Tools and Technologies Cartographers Use
Before we bring this beginner’s guide on cartography to a close, we want to touch on the method behind the madness. How do cartographers actually bring their work to life? Here are some of the most common tools and technologies used along the way…
Traditional Cartographic Tools
Historically, cartographers relied on a variety of manual tools and techniques to create maps, such as drafting instruments, compasses, and surveying equipment. Meticulous craftsmanship and attention to detail were essential in producing accurate, visually appealing maps.
While traditional tools still have a place in cartography, they paved the way for modern technology that has greatly expanded the capabilities and efficiency of mapmaking. One instance of this is GIS.
Geographic Information Systems (GIS)
GIS has revolutionized cartography by enabling the seamless integration of spatial data, analysis, and map production. It allows cartographers to create, edit, and analyze geographic data using layers, making it easier to manipulate and visualize complex information.
GIS has applications in various fields, such as urban planning, environmental management, and disaster response.
Remote Sensing and Satellite Imagery
Remote sensing and satellite imagery have transformed cartography by providing high-resolution, up-to-date data on the Earth's surface. Cartographers can now access detailed images and data from satellites, drones, and airborne sensors, which can be used to create more accurate and timely maps.
Remote sensing has enabled breakthroughs in areas like climate change monitoring, natural resource management, and global mapping.
Web Mapping and Online Platforms
Web mapping and online platforms have democratized cartography, making it more accessible and interactive than ever before. Online mapping services, like Google Maps and OpenStreetMap, provide users with easy access to detailed maps and location-based information.
Furthermore, web-based tools and platforms allow cartographers to create, share, and collaborate on maps with greater ease and flexibility, fostering innovation and expanding the reach of cartographic knowledge.
Wrapping Up Our Beginner’s Guide to Cartography
At this point, it’s time to wrap up our beginner’s guide to cartography. So, what is cartography?
The cartography definition can be summarized as the process behind map-making. It’s that simple. But as you can see, the history behind cartography and the processes that go into this discipline are far from simple.
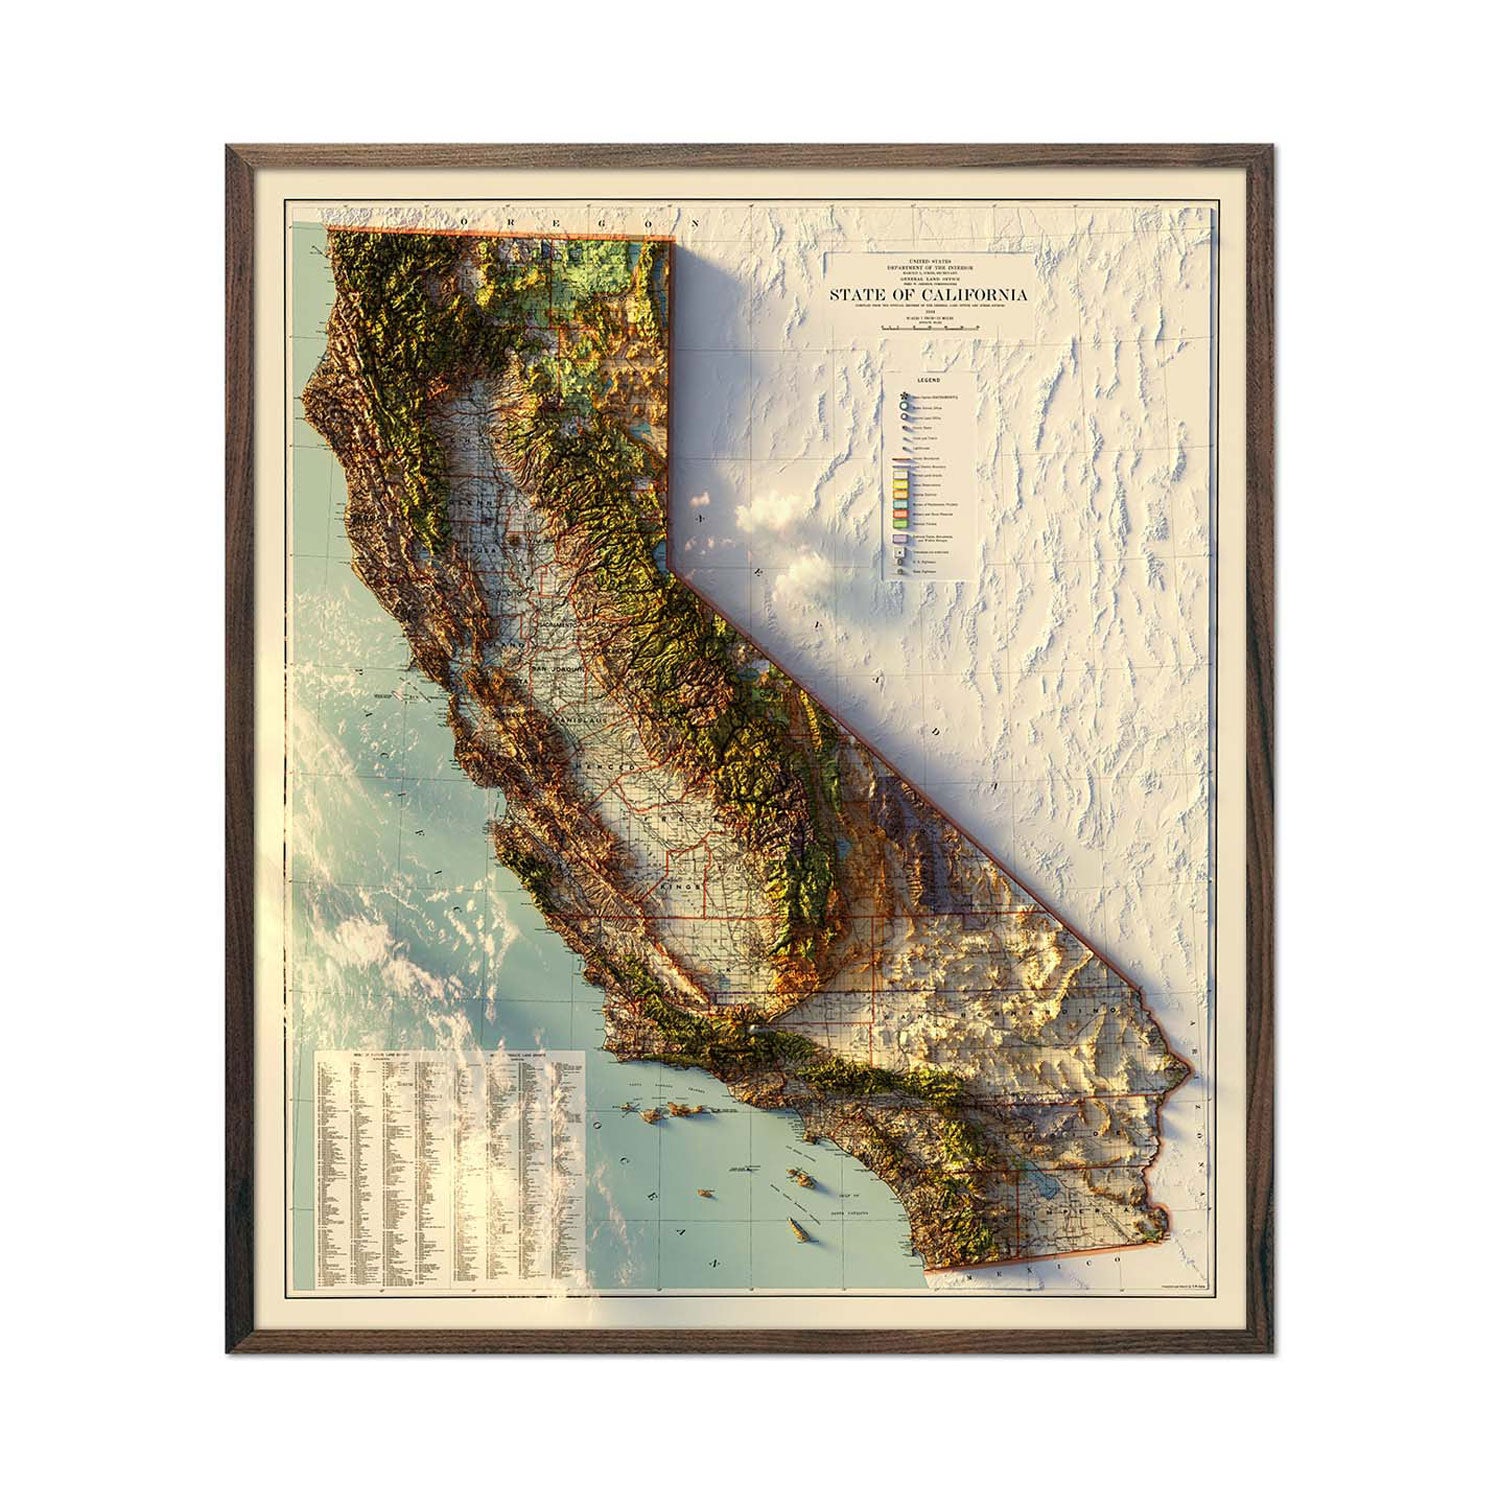
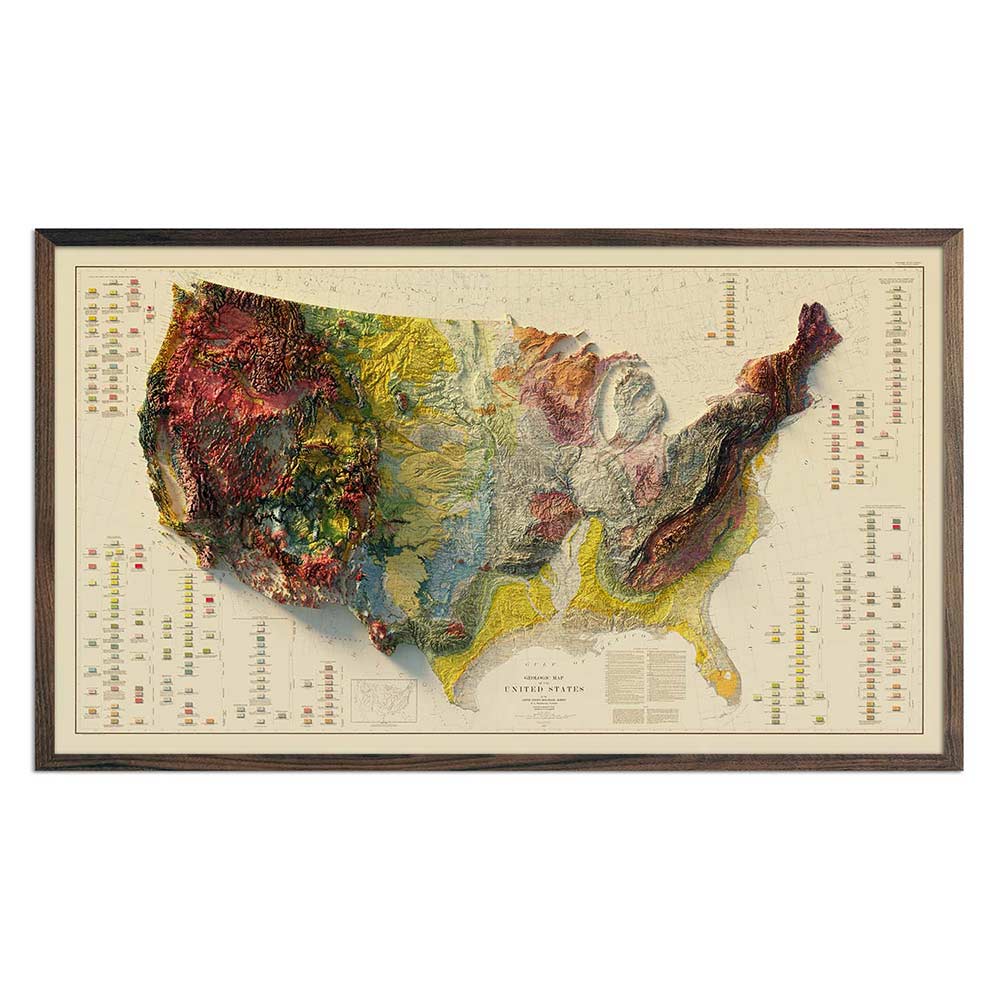
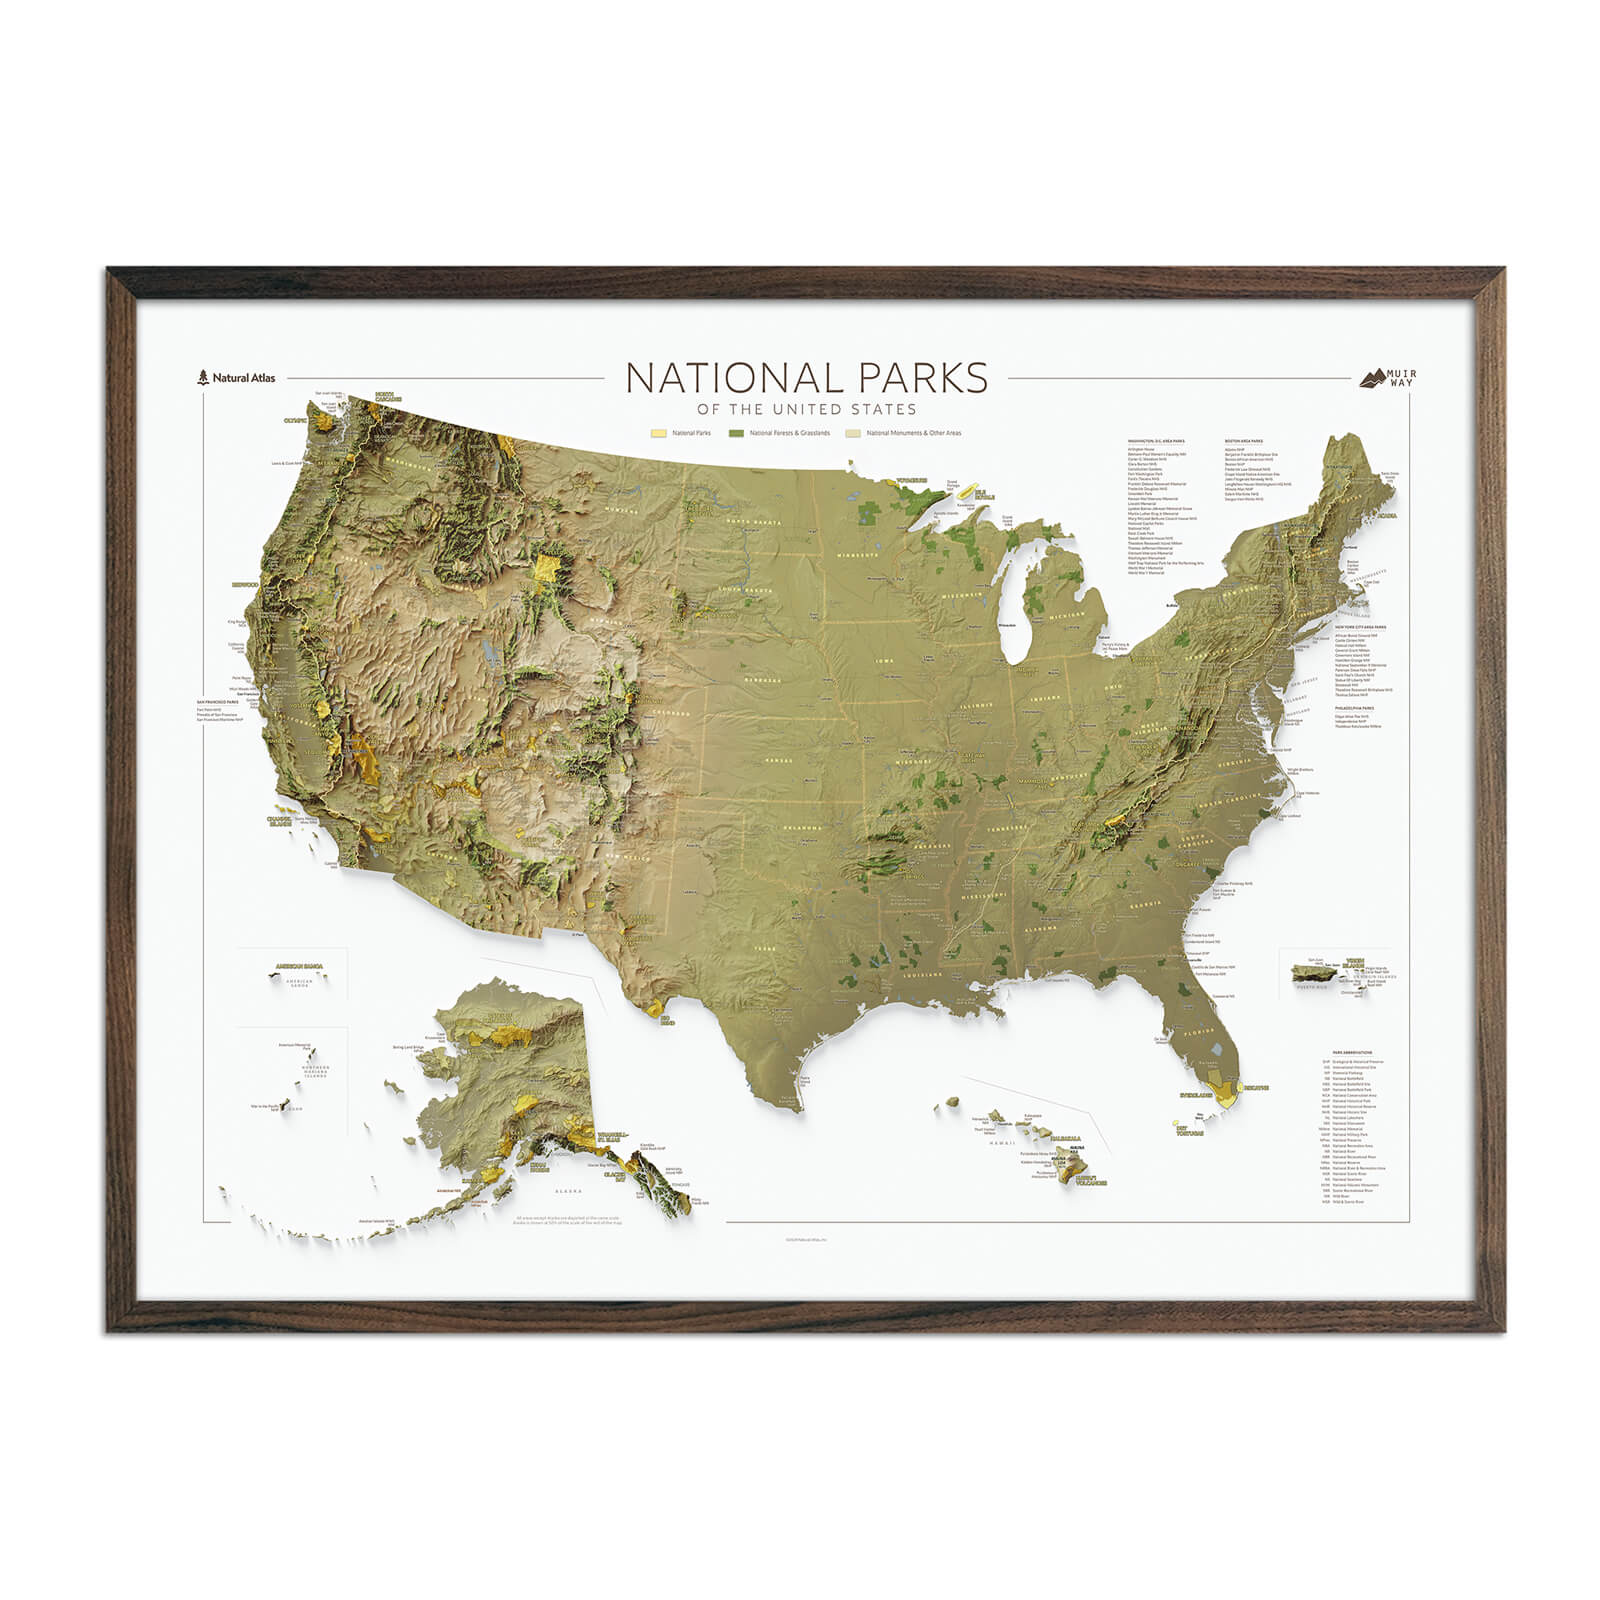
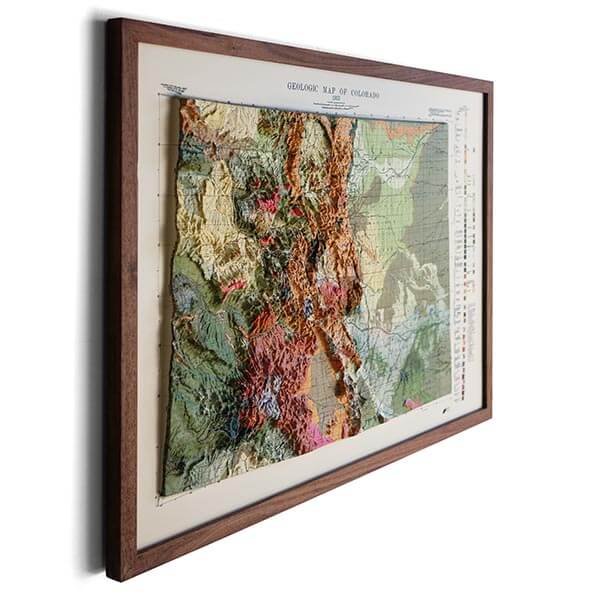
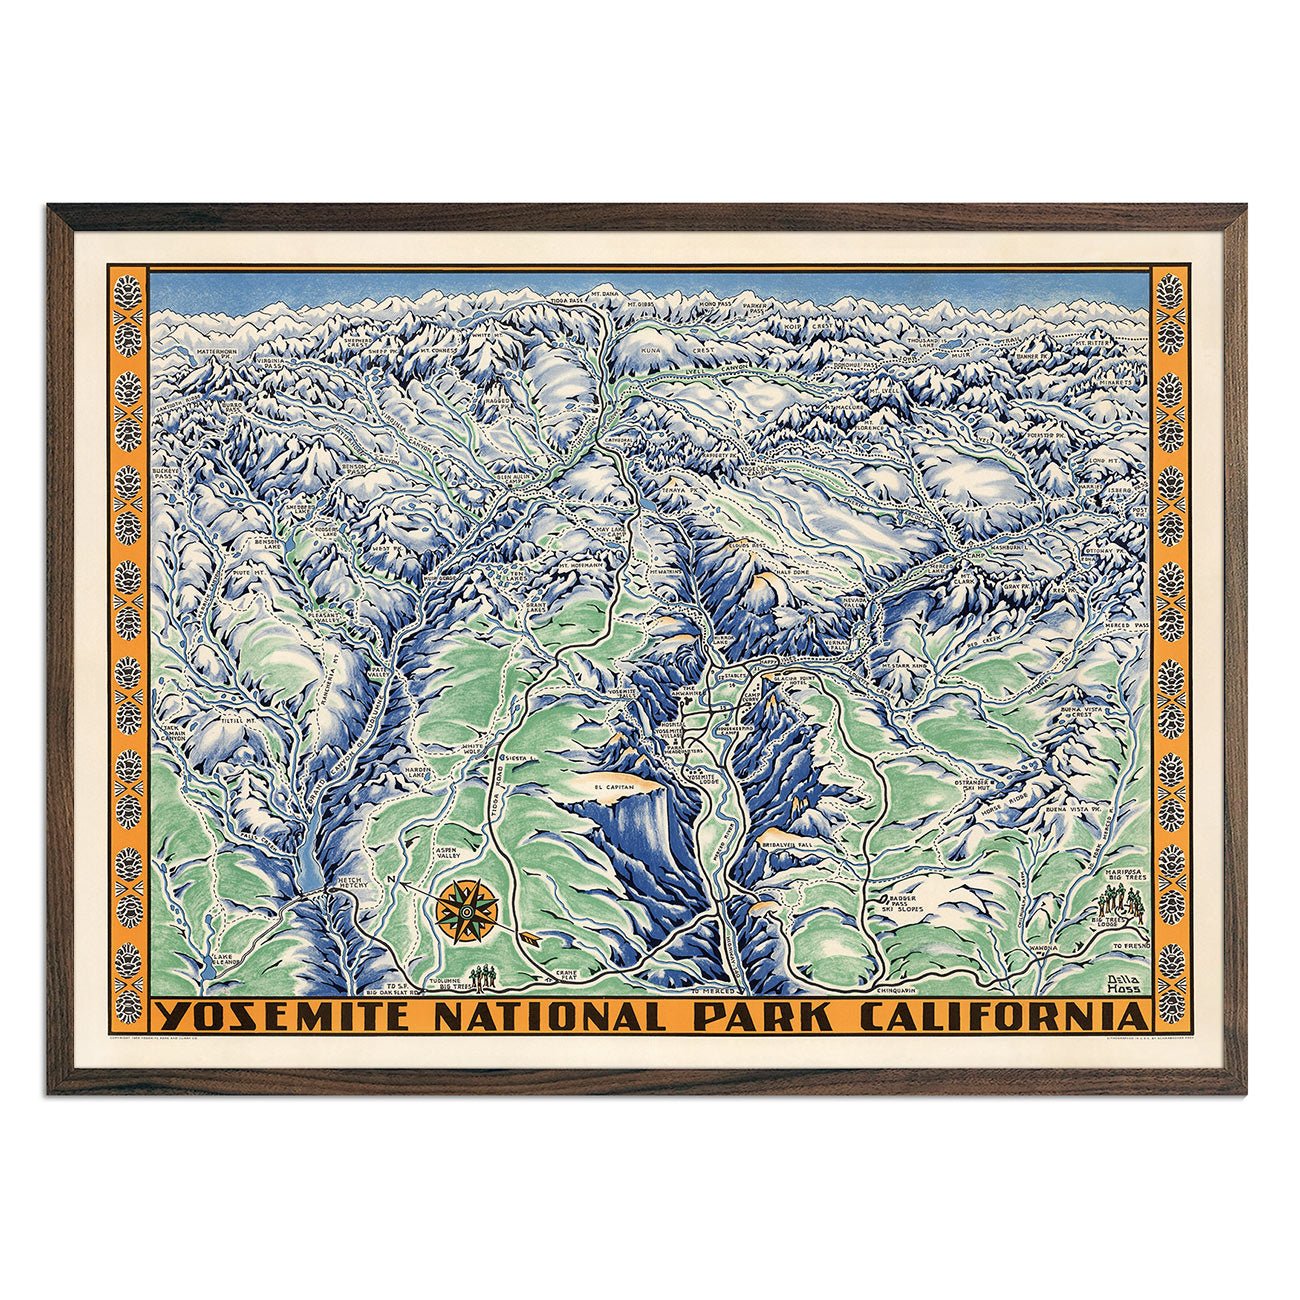
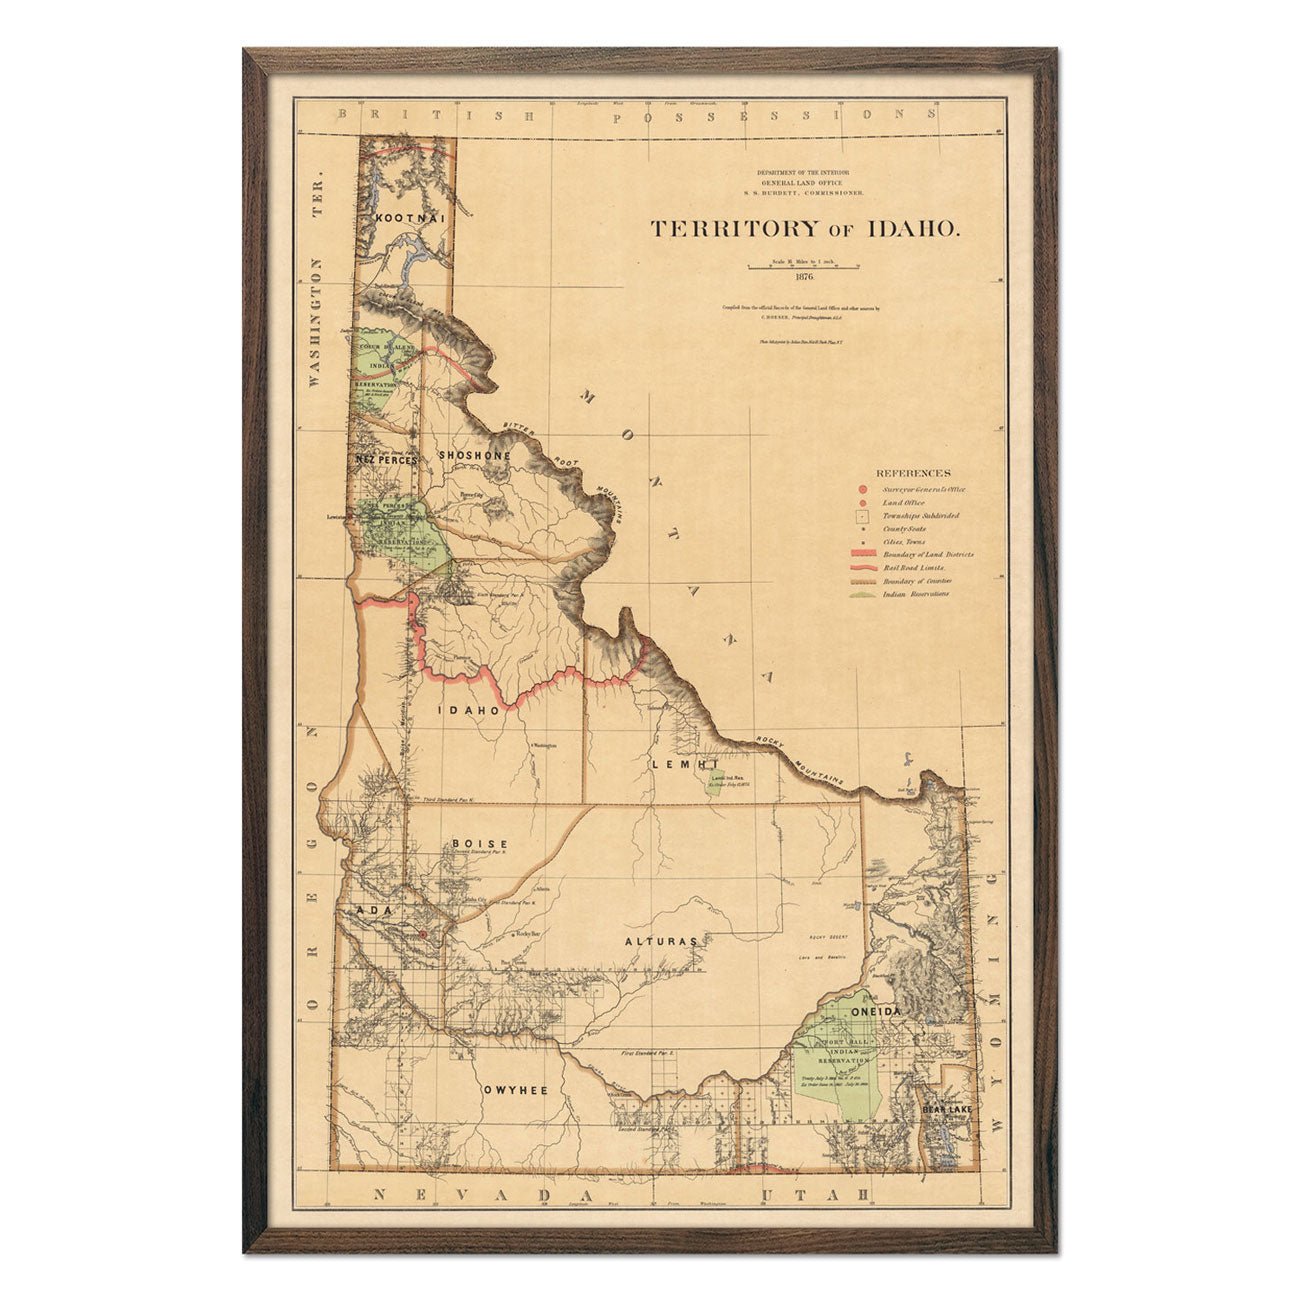
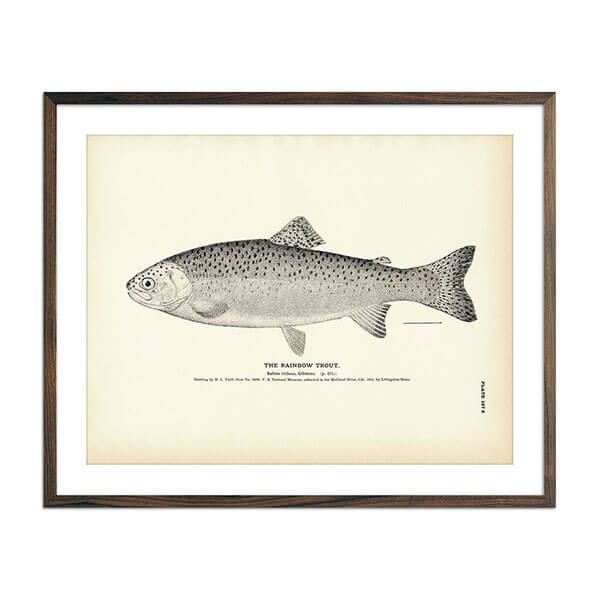
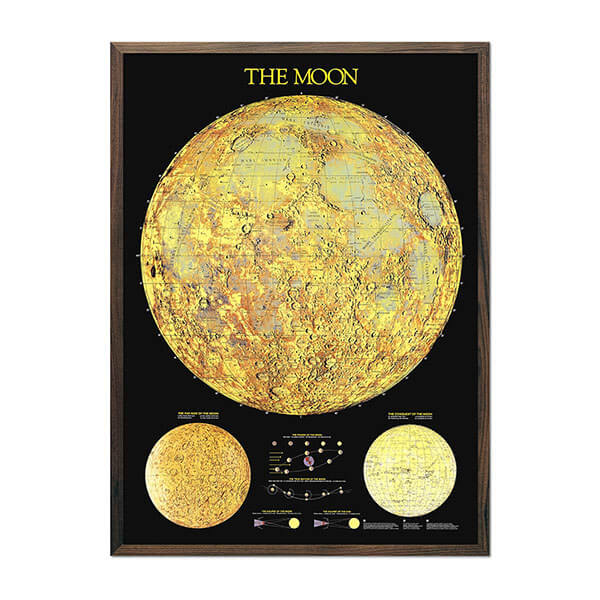
If you want to celebrate the beauty of cartography now that you have a better understanding of what goes into it, you can explore our catalog at Muir Way. We have blended our love for our planet with our passion for cartography to create an array of stunning maps to hang on your wall.
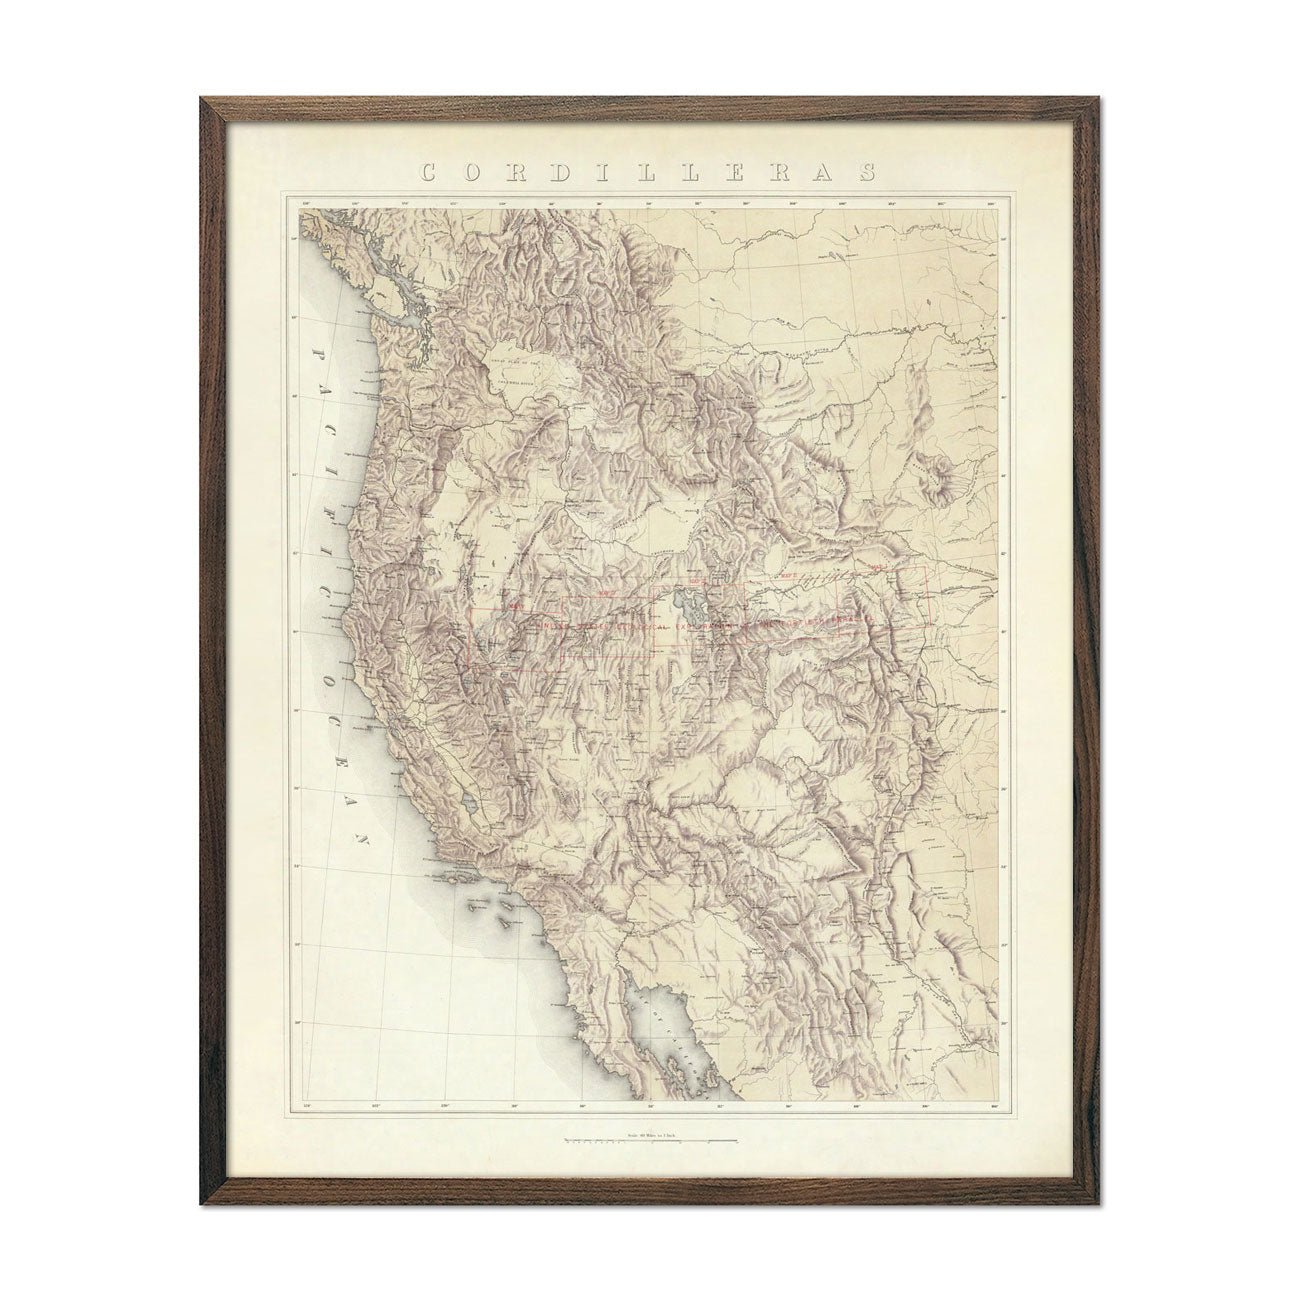
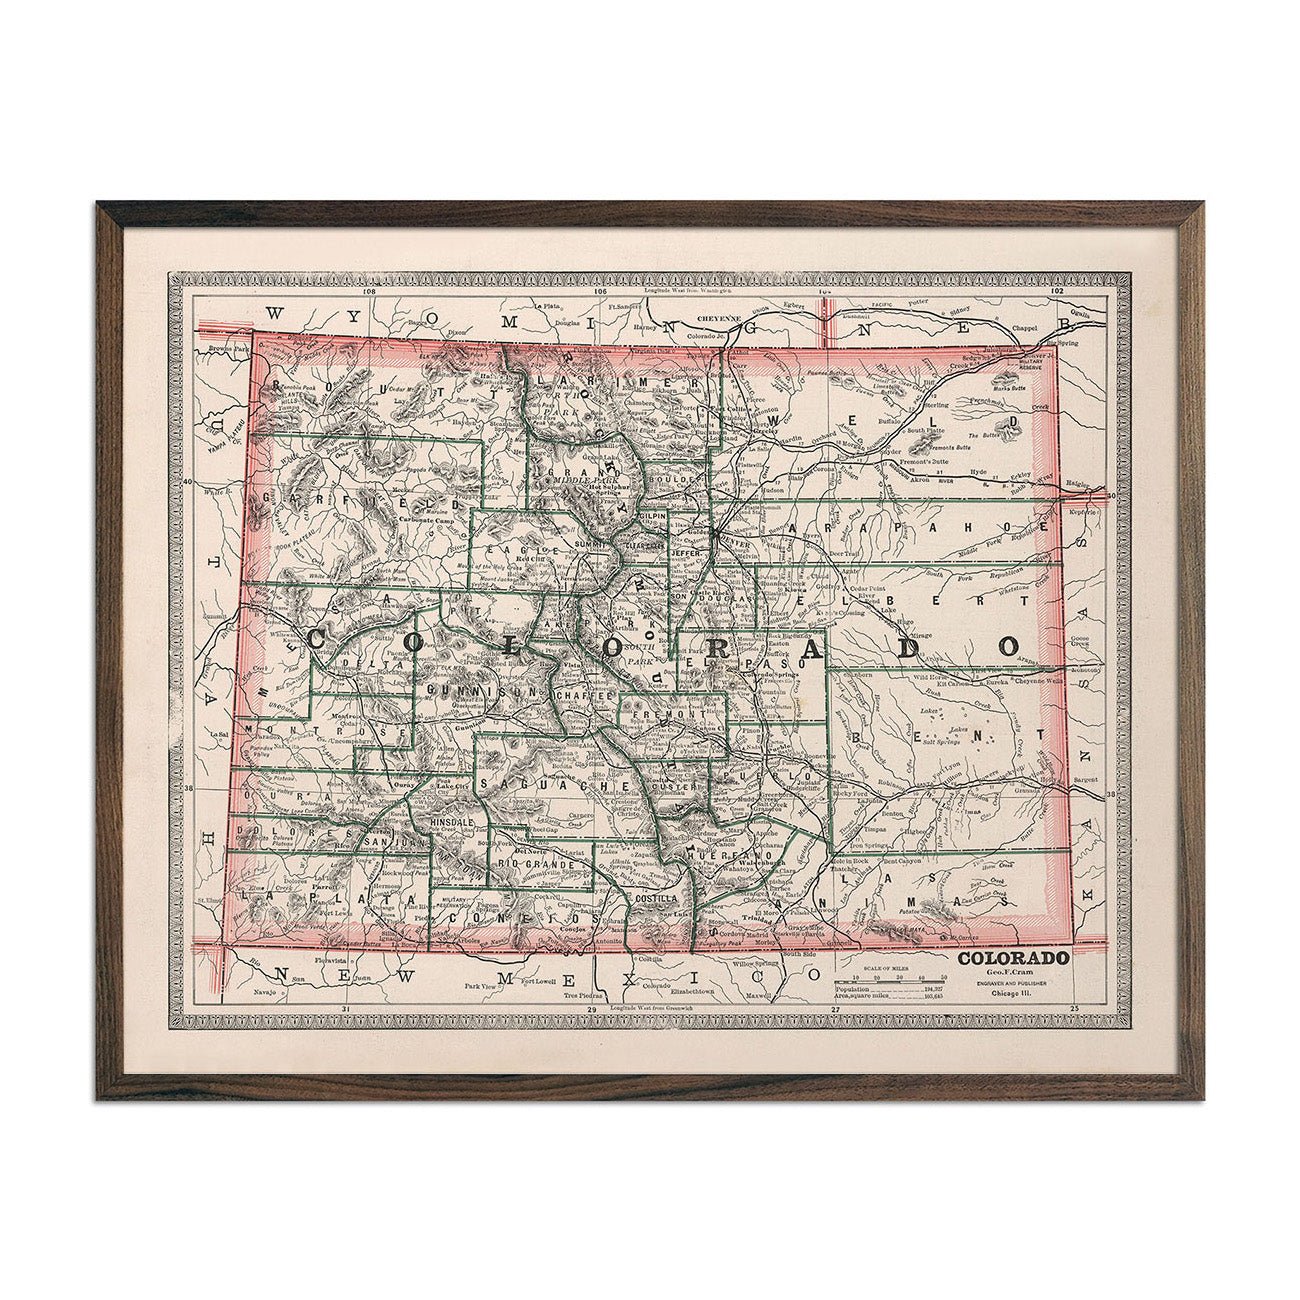
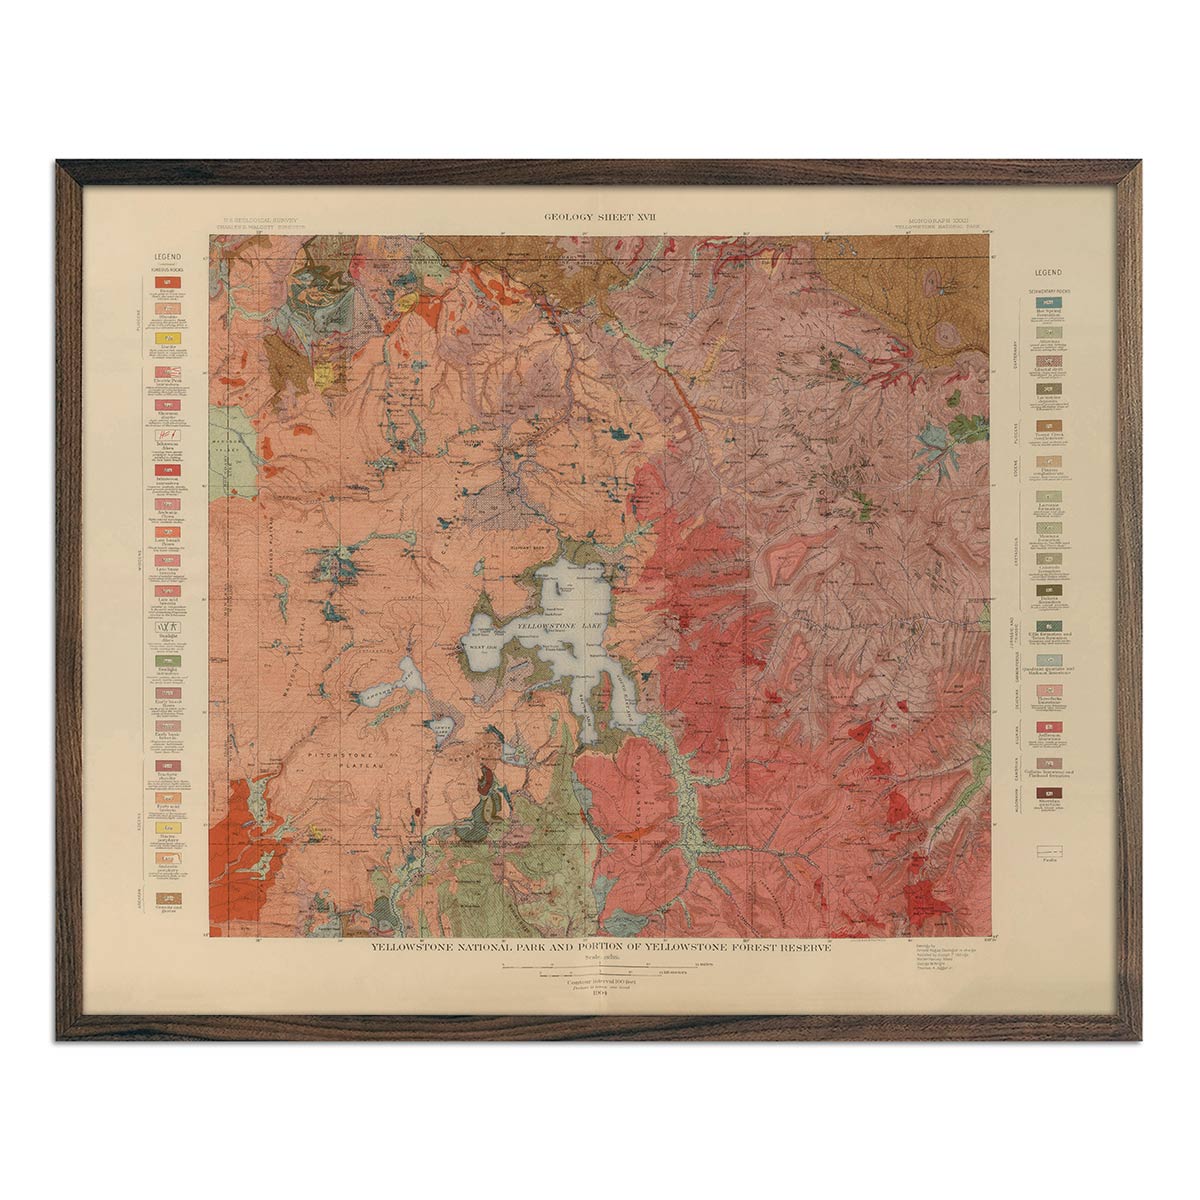
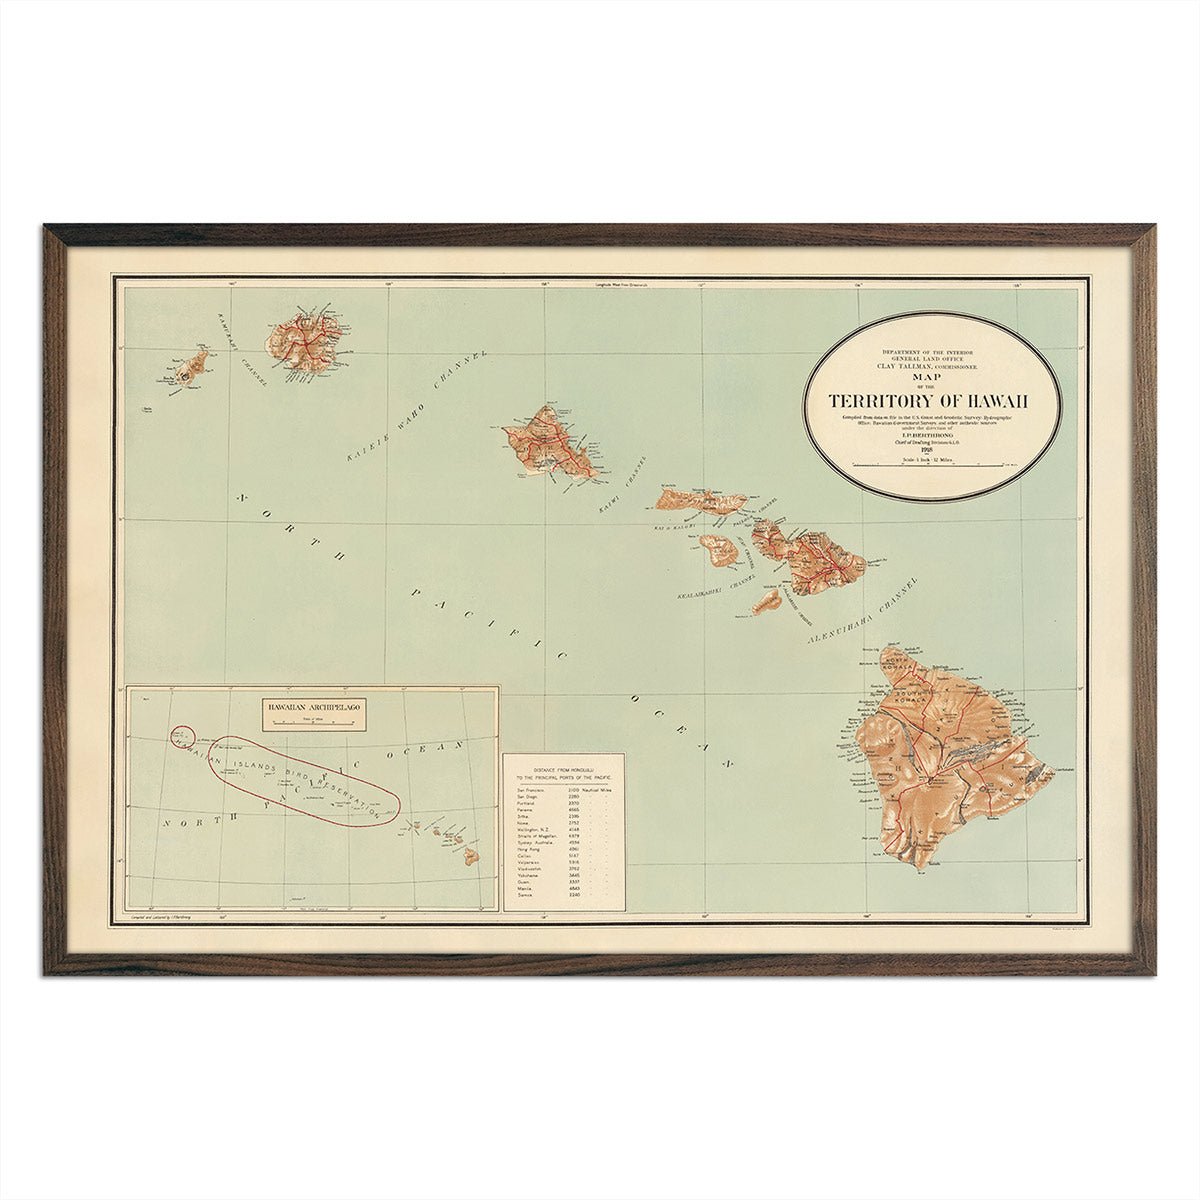
From national parks maps to vintage relief maps, US mountain ranges maps, 1883 maps of the US, elevation maps, and our 3D raised relief maps - we’ve got something for everyone. Take a look and see what catches your eye in our collection of map art!