
What is a quadrangle map or “quad” map?
Quadrangle maps or quads are a type of topographic map produced by the United States Geological Survey (USGS) that divides the United States into areas or quadrangles bounded by lines of latitude and longitude. These maps have two distinctive features: 7.5-minute length and breadth at a 1:24,000 scale.
 1
1
The History of USGS Quadrangle Topographic Maps
Between 1947 and 1992, the USGS produced its first 7.5-minute map series, each map covering one-quarter of the previous 15-minute map series at the new, 1:24,000 scale. Developing technology enabled cartographers to create detailed maps with even more accuracy. This series of quadrangle maps was generated using newer photogrammetric and aerial photography surveying and mapping techniques. These topographic maps provide valuable tools for many different industries including government, education, scientific research, planning, recreation, and environmental studies.
 2
2

3
How to Read a Quadrangle Topographic Map
There are specific components that make up a quadrant map and understanding them are critical to reading these maps. Firstly, you’d want to take notice of the map’s title and series. Maps are typically named after prominent, local physiographic features, such as important peaks, rivers, valleys, etc. A map series is determined from how many minutes it covers, thus the 7.5-minute series being so named.
Mapmaking terminology - reading distance in minutes
One of the key defining features of a quad map is its 7.5-minute coverage; 7.5-minutes longitude by 7.5-minutes latitude. In mapping, a minute is an angular measurement of position on the earth’s surface, with one degree, latitude or longitude, being divisible into 60 minutes. 7.5 minutes equals 1/8th a degree of latitude and longitude. This is equivalent to an area of 49 to 71 square miles or 126 to 183km2.
Using latitude and longitude lines
The world is divided into 180 degrees of latitude: 90 north and 90 south of the equator. Latitude lines3 (parallels) are horizontal and are of an equal distance of 69 miles to one another (one degree of latitude always equals 69 miles). The world has 360 degrees of longitude - 180 west and 180 east of the Greenwich Meridian (runs through London, UK). Longitude lines3 (meridians) stretch from the earth’s north and south poles, dividing the earth into vertical sections. The distance between longitude lines is not constant and varies depending on the vertical location, or latitude, of a point on a longitude line. For example, at the equator one longitude degree equals the full 67 miles, while at both poles, the distance of one degree is zero, as all longitudinal lines meet here.
 4
4
Quad maps’ scale and why it matters
Quad maps use a 1:24,000 scale for imperial units which translates to 1 inch on the map corresponds to 2,000 feet in the physical world. This scale allows quad maps to show more detail which is most useful for engineering, planning, recreational and navigational purposes.
Quad map scale and legend
Other information is visible at the bottom of the map sheet, including copyright and printing information, original map production year, and when the map was updated. The map legend is located here, which explains the symbols, lines, and colors used on the map. The amount of symbols used will differ from map-to-map but the same symbols are used throughout a map series.
US Topo Maps - A New Generation of USGS Quad Maps
The USGS released the new generation, 7.5-minute quad maps in 2009, called US Topo, available in digital form and extracted using GIS databases. The integration of GIS data allows these maps to be accessed in traditional map form, including PDFs, and from digital, spatial-data platforms that require specific knowledge - mapping software such as QGIS, ArcGIS, etc. Over time data improves and new layers are added to these maps such as aerial photos, shaded relief, and different feature classifications. USGS continues to update these US Topo maps at regular intervals. The first 3-year production cycle of US Topo maps was completed in 2012, with subsequent editions in 2015 and 2018. The newest edition is expected to be complete by 2021. These 3-year cycles apply to 48 states. Hawaii, Alaska, Puerto Rico, and US Virgin Island are topographically covered at different times and using different scales. Historically, Alaska has only been partially analyzed and is estimated to be mapped completely by 2022.
The Historical Topographic Map Collection (HTMC)
In 2011, the USGS initiated another project known as the “Historical Topographic Map Collection” (HTMC), which supplied high-resolution scans of more than 178,000 historical maps of the US at various scales ranging from 1:25,000 and larger. These maps were all originally published as paper documents between 1884 and 2006. The HTMC project presents snapshots of how landscapes have been changed over time.
Different types of USGS topographic maps
There are some notable differences between each of the topographic map series mentioned. Historical USGS topographic maps5 were created using direct field observations and drawn by hand, considered archaic by today’s standards. They were produced in 1884-2006 with scales of 1:25,000 and up. Historically, the first USGS 7.5 minute quad series 6 (1945-1992) differed slightly due to its specifics (7.5-minute and 1:24,000 scale) and its inclusion of feature classes that had not been shown in earlier maps; these include pedestrian trails, power lines, different boundaries, and buildings, etc. The USGS US Topo series7, produced after 2009, mimicked the original quad series, but is mass-produced and updated with GIS databases. The US Topo series also allows customization, user-friendly application, uses high-resolution aerial photos, and ongoing advancement.
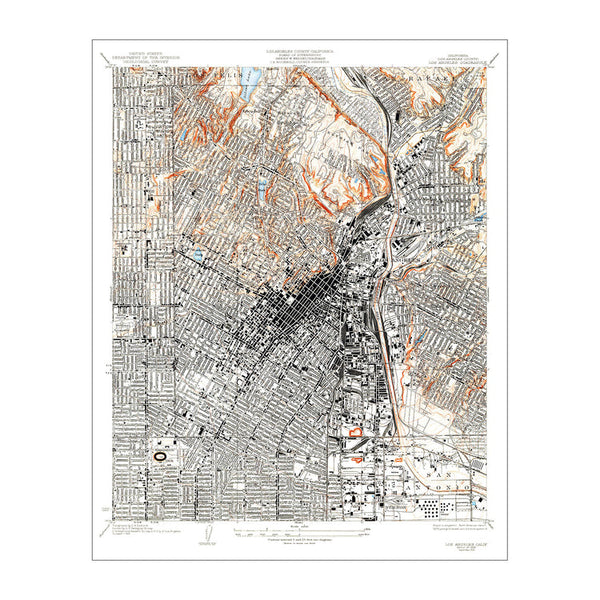
1931 - 1:24,000 scale Los Angeles, CA 5


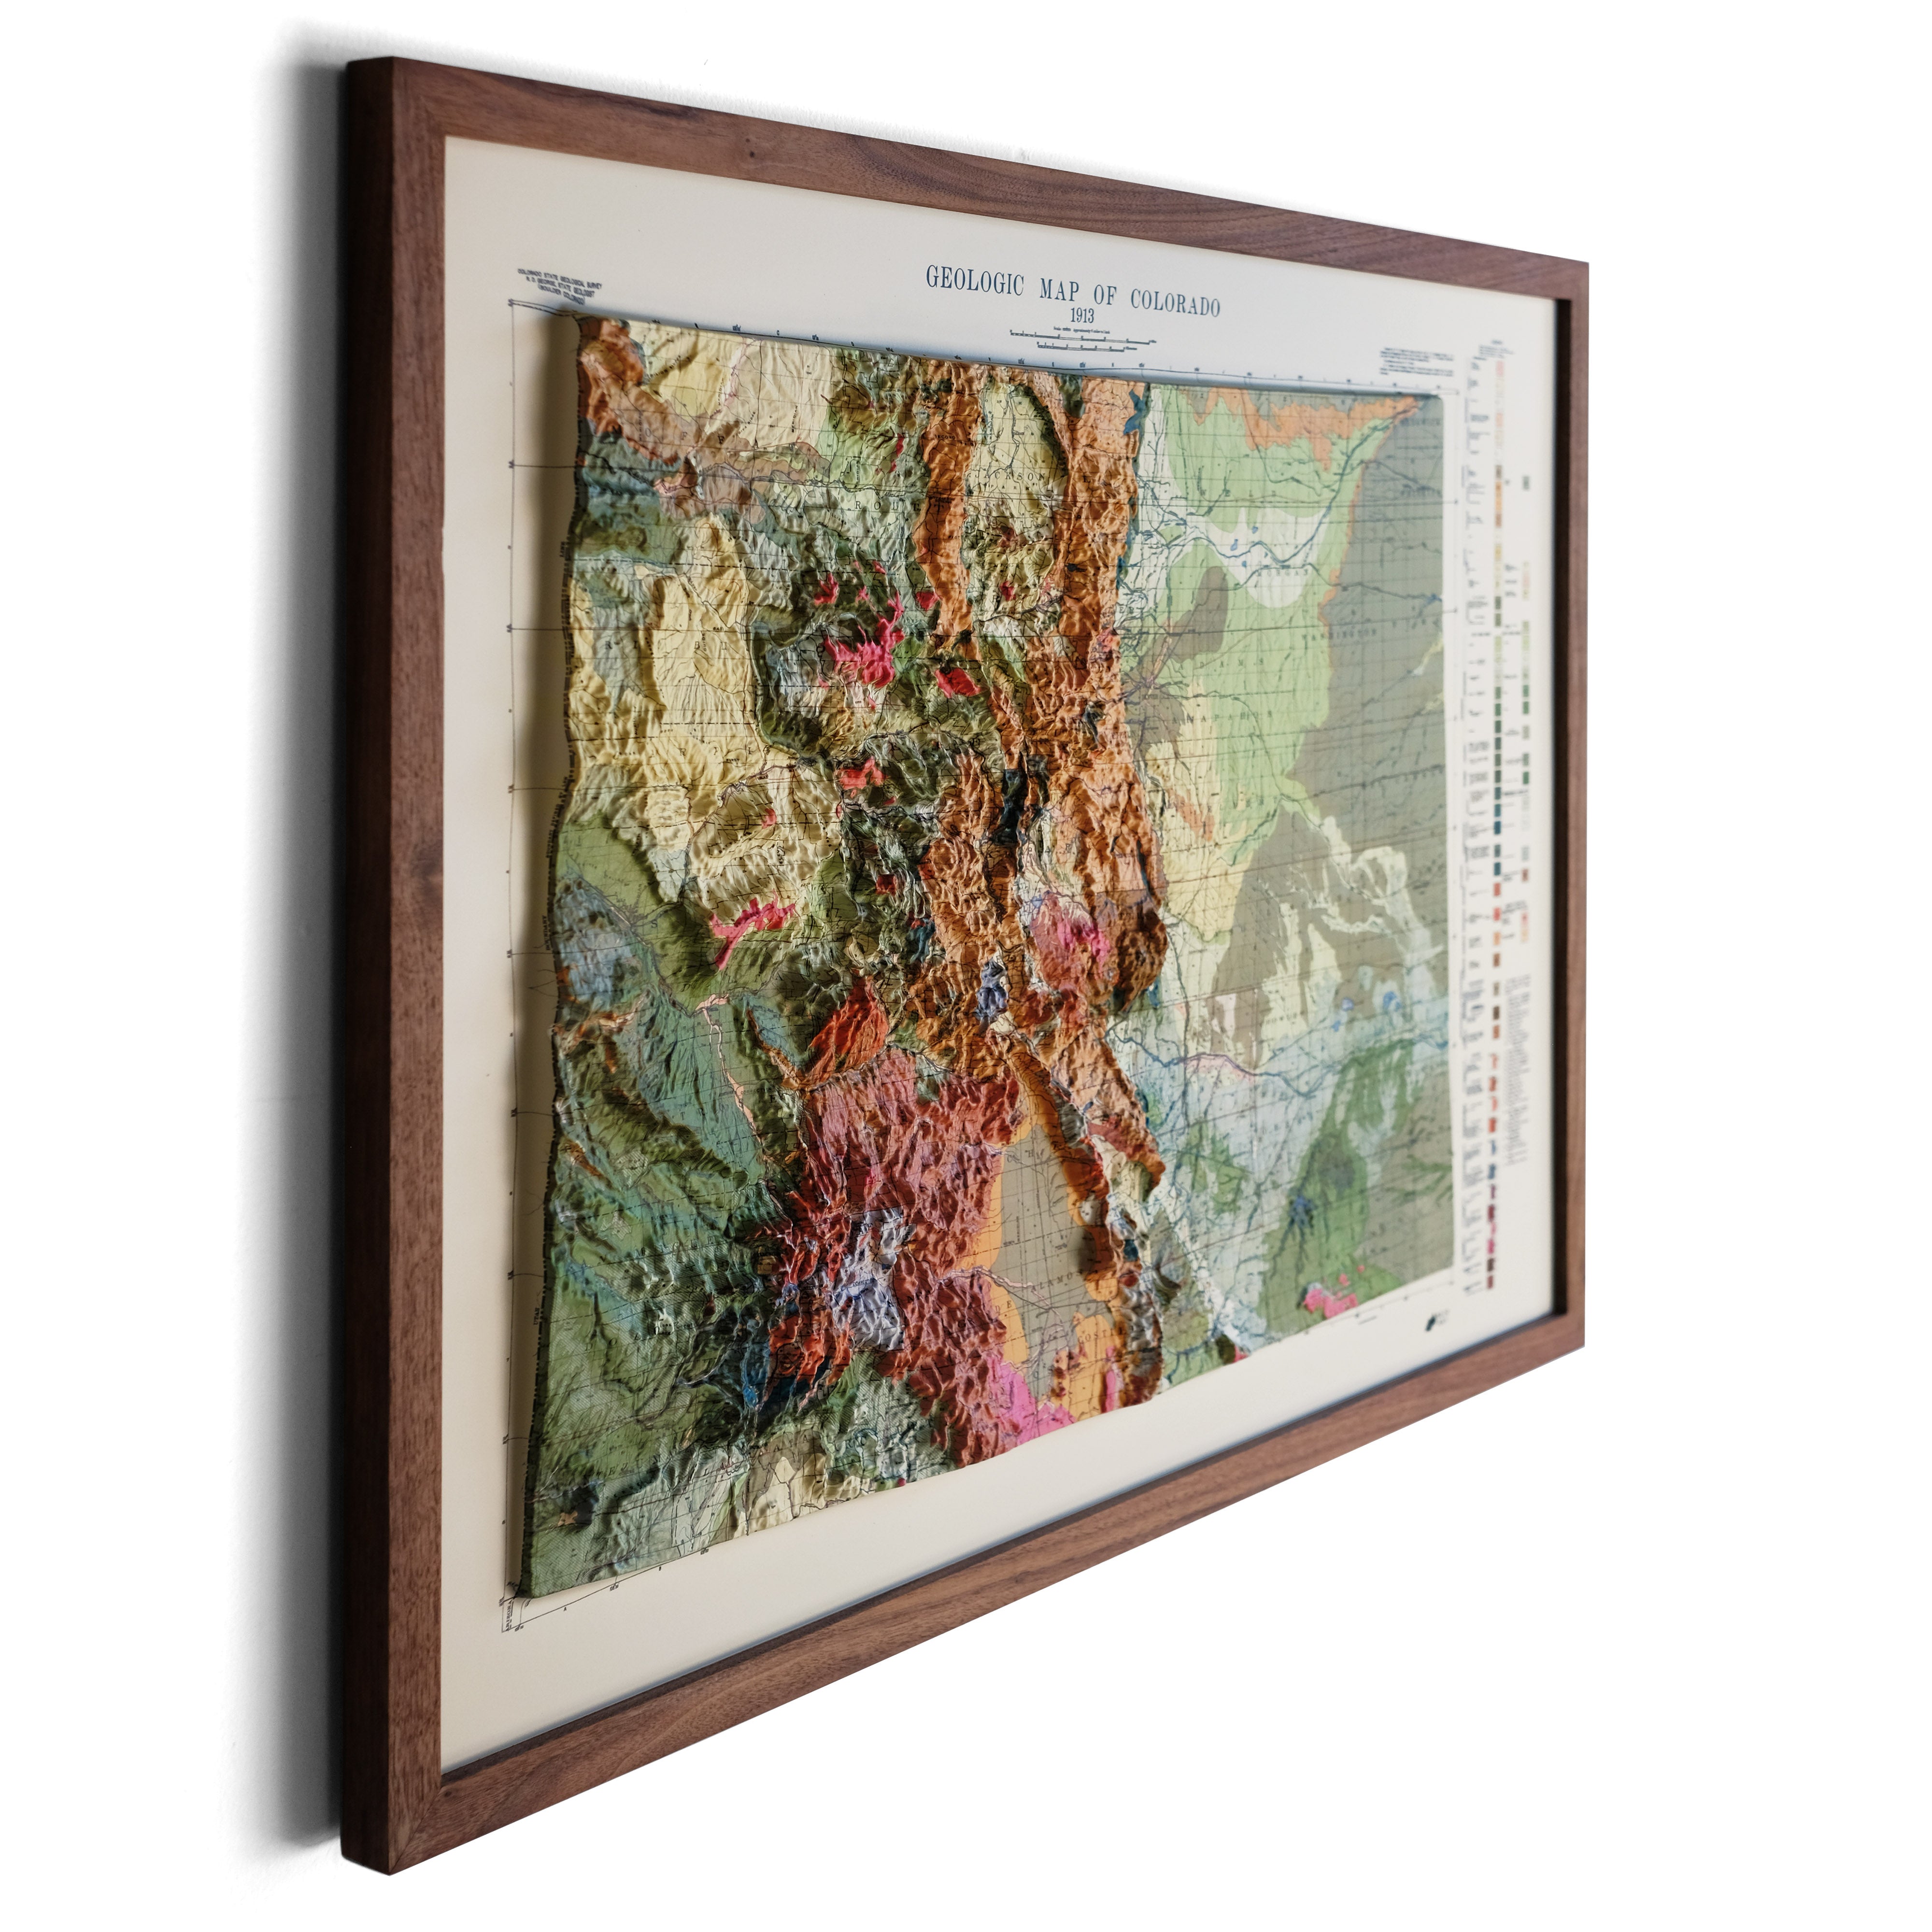
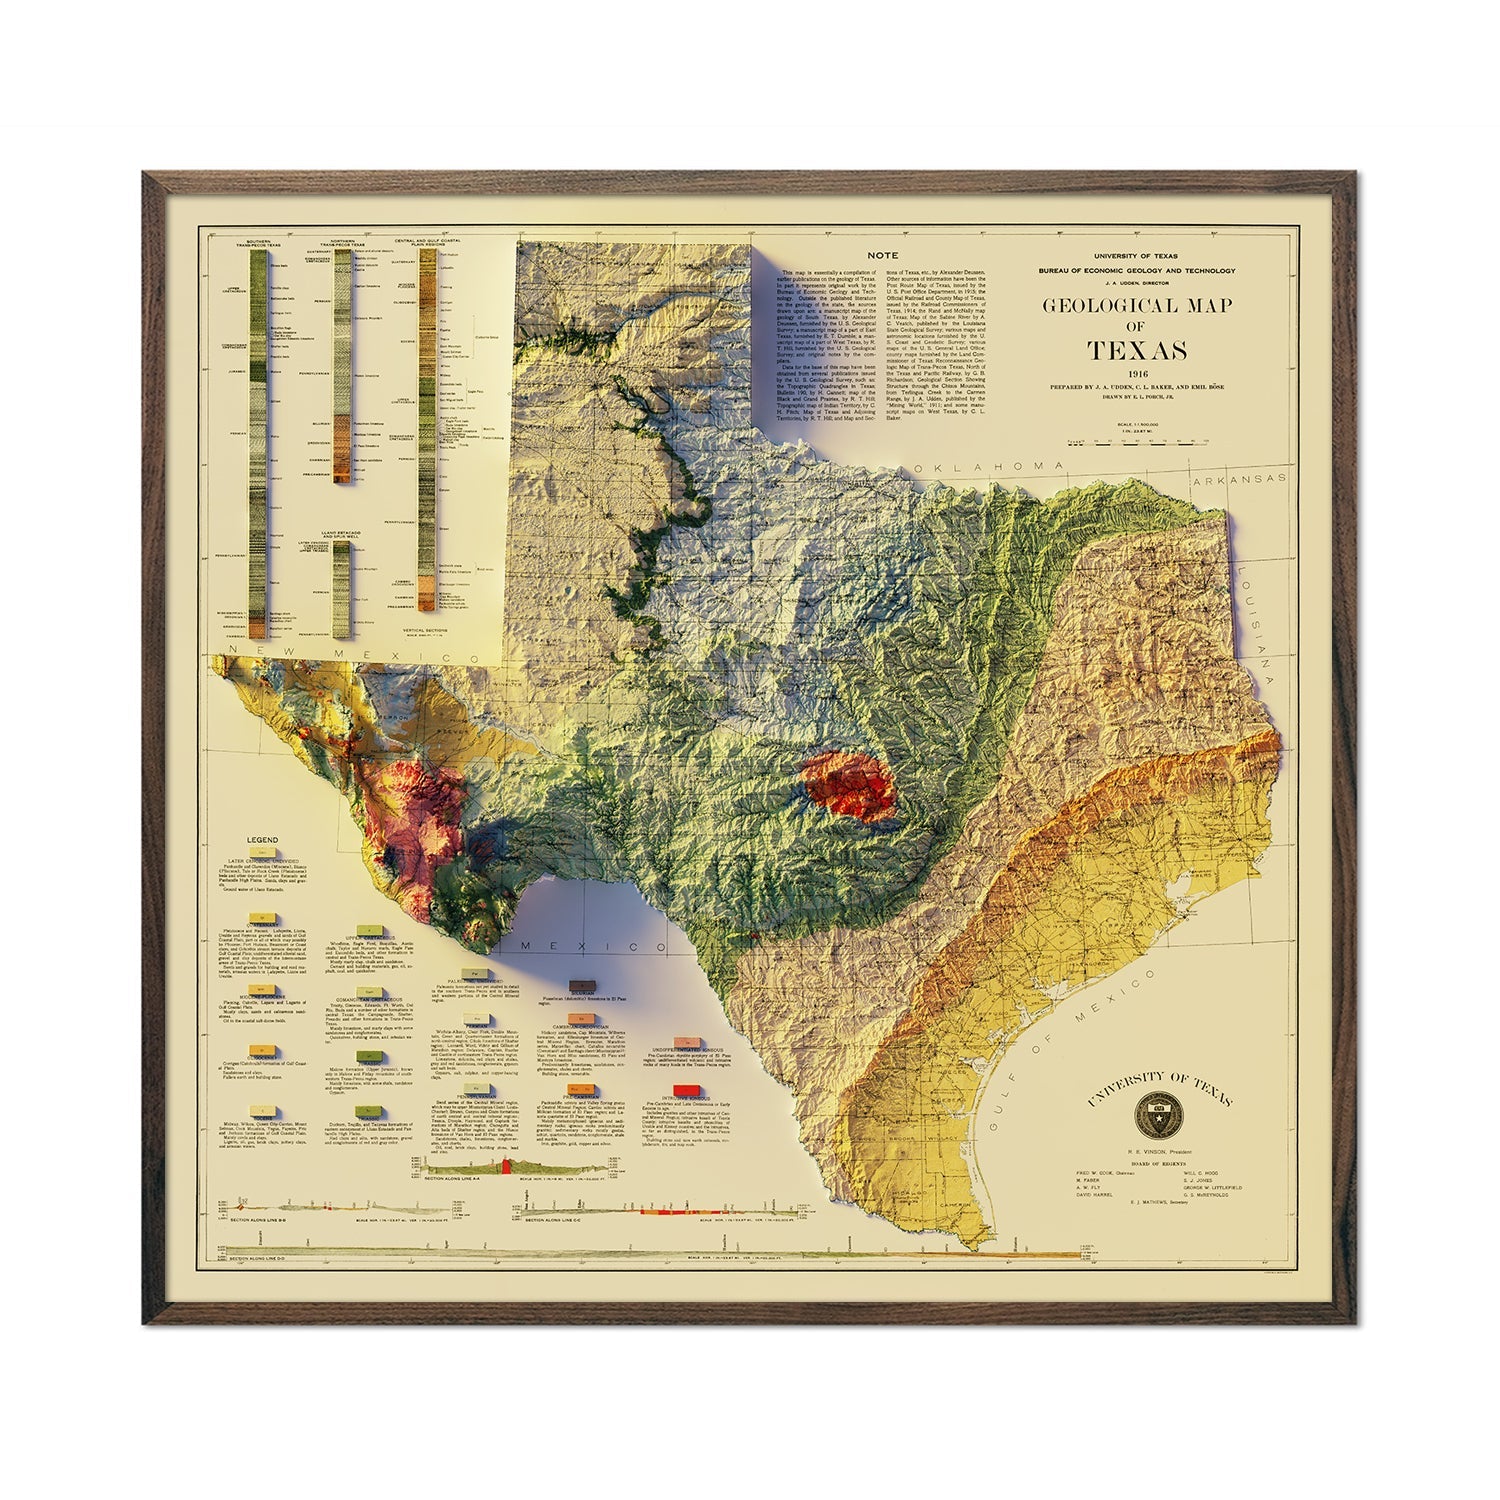
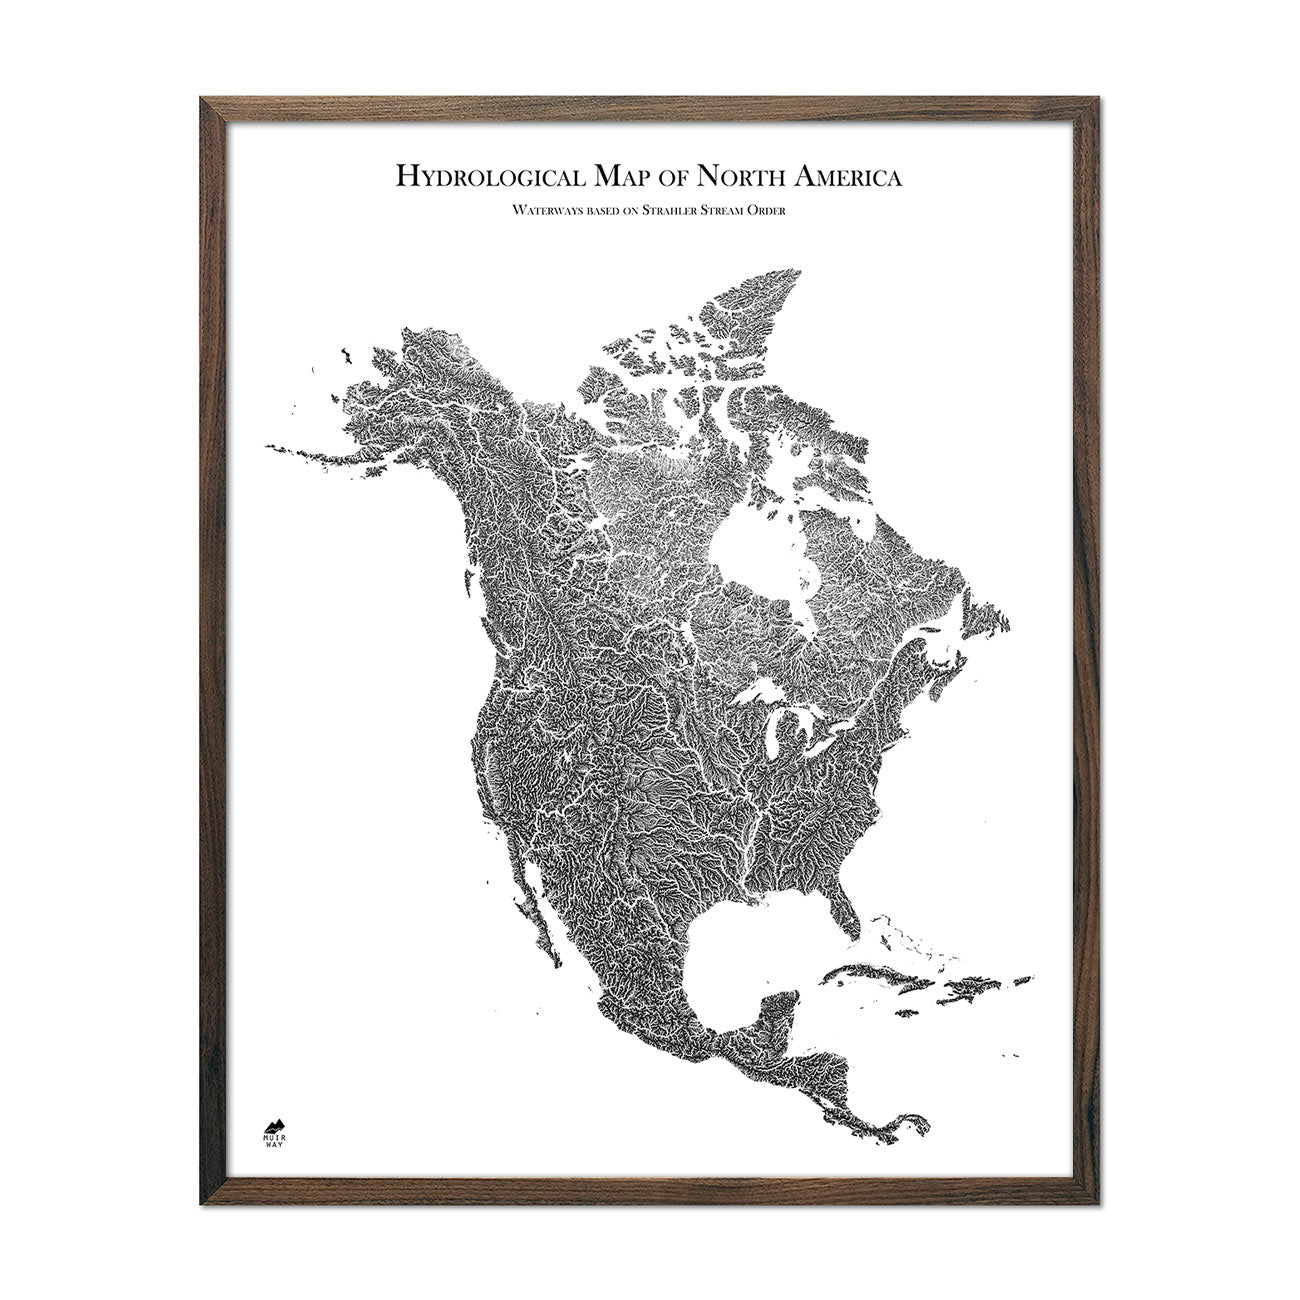
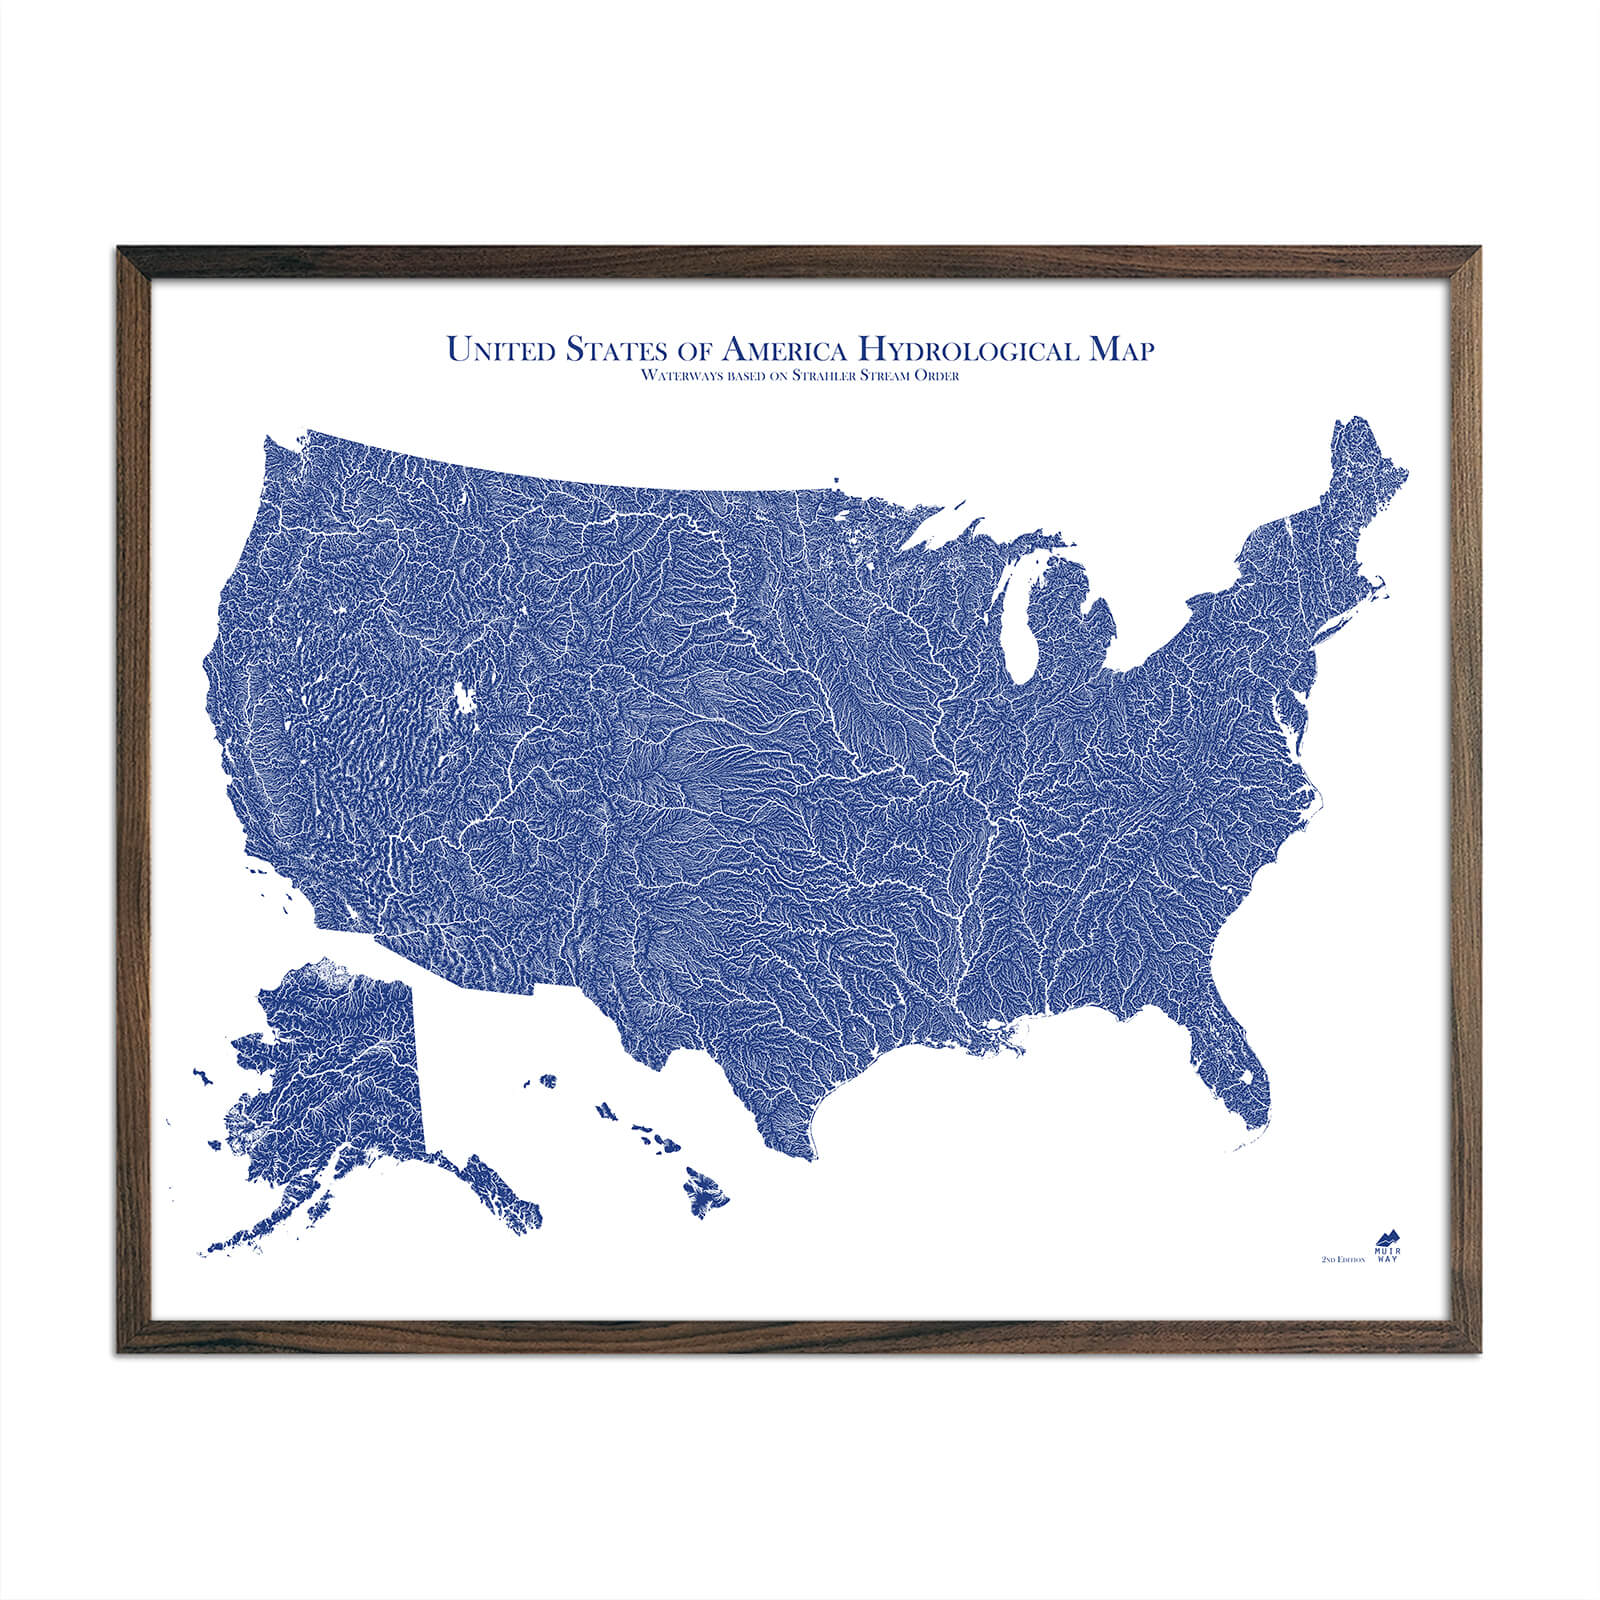
Many of the maps we create at Muir Way make use of USGS data to showcase topographic terrain in a whole new way. Browse our TOPO Map series of Ski Resorts illustrating their topography in a colorful, simple style based on USGS Quadrant maps. For a more classic look, we have a collection of vintage USGS Topographic maps restored to their original beauty.
Source:
https://en.wikipedia.org/wiki/Quadrangle_(geography)
https://pubs.usgs.gov/gip/usgsmaps/usgsmaps.html
https://www.usgs.gov/core-science-systems/ngp/topo-maps/
https://www.usgs.gov/core-science-systems/national-geospatial-program/us-topo-maps-america
https://www.e-education.psu.edu/natureofgeoinfo/c6_p4.html
https://outdoorblueprint.com/read/how-to-read-a-topographic-map/
Image Source:
- https://muir-way.com/collections/north-carolina/products/charlotte-nc-1961-usgs-map
- https://www.conservation.ca.gov/cgs/publications/maps-data/rgm/preliminary
- https://muir-way.com/collections/usgs-1/products/arches-national-park-usgs-map
- https://outdoorblueprint.com/read/how-to-read-a-topographic-map/
- https://muir-way.com/collections/usgs-1/products/los-angeles-ca-1931-usgs-map
- https://muir-way.com/collections/usgs-1/products/new-orleans-la-1954-usgs-map
- https://muir-way.com/collections/usgs-1/products/portland-or-1940-usgs-map